
Dogecoin is showing early signs of stabilization after months of sustained selling, with the token attempting to form a bottom in the $0.067 to $0.070 range. The setup has genuinely improved over recent sessions, but it remains too early to call a confirmed reversal, since DOGE continues trading beneath every major moving average that traders use to define a broader trend shift.
Short-Term Momentum Shows Early Improvement
DOGE has defended a consistent price range since July and currently trades near $0.0700 to $0.0705. Rather than continuing to produce fresh lows, the token has compressed into an increasingly tight band, a pattern that typically signals fading selling pressure even before a genuine reversal takes hold. The shortest moving average, currently near $0.0711 to $0.0712, offers the first modestly positive signal. The 50-day moving average sits only slightly higher, around $0.0723 to $0.0724, and DOGE is now directly testing that level; reclaiming both would mark the first meaningful technical advance in weeks.
The Relative Strength Index has also improved, moving from readings near 40 to 43 up to roughly 45.8. While momentum remains below the neutral 50 threshold, it has moved well clear of the extremely depressed readings that characterized DOGE’s prior sell-off phases, indicating that selling intensity is easing even without confirmed buying dominance.
Longer-Term Trend Structure Still Points Down
A stabilizing bottom and a confirmed new uptrend remain two distinct things. The 100-day moving average, near $0.0813 to $0.0815, sits well above current price and represents a much stronger resistance barrier than the levels DOGE is testing now. More significantly, the 200-day moving average continues declining and currently sits near $0.0971 to $0.0974, confirming that the token’s medium-to-long-term trend structure remains bearish despite the recent stabilization. DOGE trades roughly 40% below its two-month peak near $0.118, and the broader weekly chart shows the token still deep within a multi-month descending channel that has yet to see a confirmed break.
Key Levels That Would Confirm a Reversal
DOGE’s immediate roadmap centers on a narrow set of levels. A sustained move above $0.072 to $0.073 would open a challenge toward $0.075, and ultimately the stronger resistance at $0.078 to $0.081; clearing that upper zone would substantially strengthen the case for a genuine reversal rather than a temporary bounce. On the downside, the $0.067 to $0.068 region must hold; a decisive breakdown below it would destroy the base currently forming and expose DOGE to a retest of recent lows, with deeper support levels near $0.065 and $0.0575 coming into play if selling accelerates.
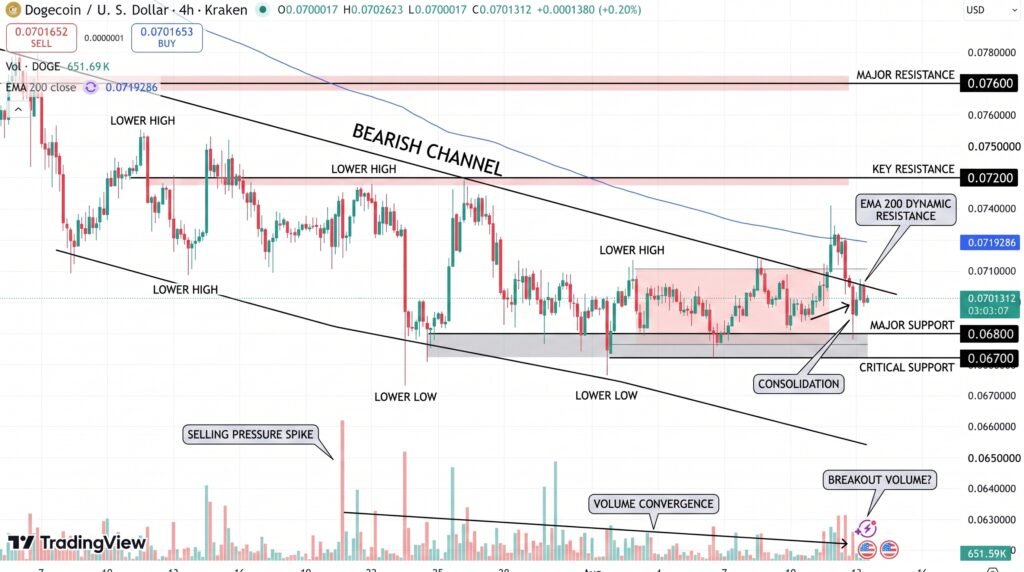
- Immediate resistance: $0.0711-$0.0724 (short-term and 50-day moving averages), then $0.075, then $0.078-$0.081
- Critical downside level: $0.067-$0.068, below which the developing base would fail
Conclusion
Dogecoin looks closer to a genuine reversal setup than it has in several weeks, with momentum rebounding, the pace of selling slowing, and volatility compressing into a tighter range. But buyers still need confirmation before the case moves from tentative to established: DOGE remains below its 50-day, 100-day, and 200-day moving averages simultaneously, a structure that has defined the token’s downtrend since earlier this year. The token may be turning a corner, but until it reclaims those higher averages with sustained volume, it isn’t out of the broader downtrend yet.
Sources & Methodology
Primary-source standard: Market-moving facts should link to original data releases, regulator notices, company filings or official project announcements whenever available. Secondary reporting is used for additional context, not as a substitute for original evidence.
Page last reviewed: