Solana’s price has stayed essentially flat near $75.30 despite a sharp surge in derivatives activity, a divergence that traders watch closely because it often precedes a more volatile move than calm price action alone would suggest. SOL futures volume more than doubled over the past 24 hours across several major exchanges, but the positioning data accompanying that surge points toward elevated risk of a downside retrace rather than a breakout.
Futures Volume Surges Across Every Major Exchange
Binance reported 24-hour SOL futures volume of approximately $890 million, up 144.8%. Bybit’s volume rose 108.6%, and OKX gained 146.1% over the same period. Smaller venues saw even larger jumps: Gate rose roughly 154%, Bitget climbed about 210%, and Hyperliquid advanced approximately 168%. Despite that surge in trading activity, SOL’s 24-hour price performance remained essentially unchanged, still trading close to $75.30, a gap that suggests the increased volume reflects repositioning and speculation rather than fresh directional conviction from buyers or sellers.
Positioning data reinforces that read. Binance’s account-level long-to-short ratio sits at roughly 2.43, while OKX shows a similar 2.42 ratio, both indicating retail traders are betting heavily on higher prices. Binance’s top-trader account ratio runs even higher, at 2.71, showing that larger, presumably more sophisticated accounts are leaning even further into long positions than the broader retail base. This kind of lopsided positioning doesn’t guarantee a decline, but it does make SOL more vulnerable to a sharp move lower if price loses key support, since a large concentration of long positions creates a correspondingly large pool of potential forced liquidations if the market turns against them.
Liquidations and Chart Structure Signal Caution
That vulnerability has already begun showing up in the data. Roughly $6.07 million in SOL futures positions were liquidated over the past 24 hours, split between $4.60 million in liquidated longs and $1.47 million in liquidated shorts, according to Coinglass, confirming that some of the recently opened long positions are already being tested and forced out.
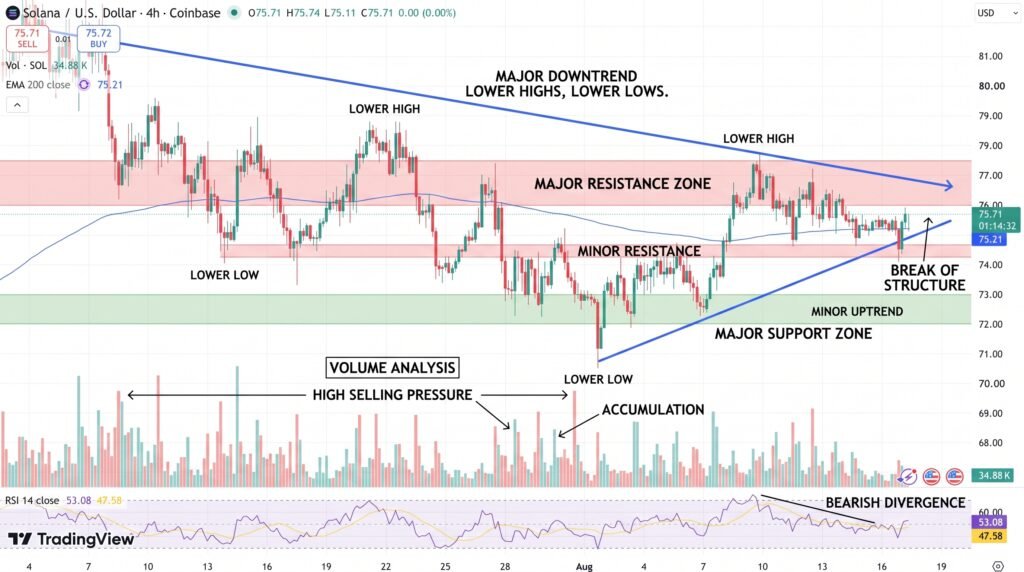
The chart adds a second layer of caution. SOL trades below its intermediate moving average near $78.10 to $78.28, and further below its longer-term 200-day moving average, which sits considerably higher near $89.26 to $89.78, indicating the broader technical structure remains weak despite recent stabilization. Short-term support sits between $74 and $75; a break below that zone could expose SOL to a move toward $70 to $72, and potentially a retest of the lows established during July and August.
- Futures volume increases: Binance +144.8%, OKX +146.1%, Bybit +108.6%, Bitget +210%, Hyperliquid +168%
- 24-hour liquidations: $6.07 million total, with $4.60 million in longs versus $1.47 million in shorts
Conclusion
If buyers regain control, the current volume expansion could ultimately prove constructive rather than risky, but that case requires confirmation SOL hasn’t yet delivered. A persistent break above the $78 to $80 zone would be the clearest signal that rising participation reflects genuine accumulation rather than speculative leverage stacking up ahead of a reversal. Until that confirmation arrives, the combination of crowded long positioning, a technical structure still capped by higher moving averages, and futures activity running well ahead of actual price movement creates asymmetric risk. If SOL cannot break out to justify the leverage building around it, a meaningful share of these newly opened positions may get forced out through another retrace rather than rewarded by a rally.
Sources & Methodology
Primary-source standard: Market-moving facts should link to original data releases, regulator notices, company filings or official project announcements whenever available. Secondary reporting is used for additional context, not as a substitute for original evidence.
Page last reviewed: