
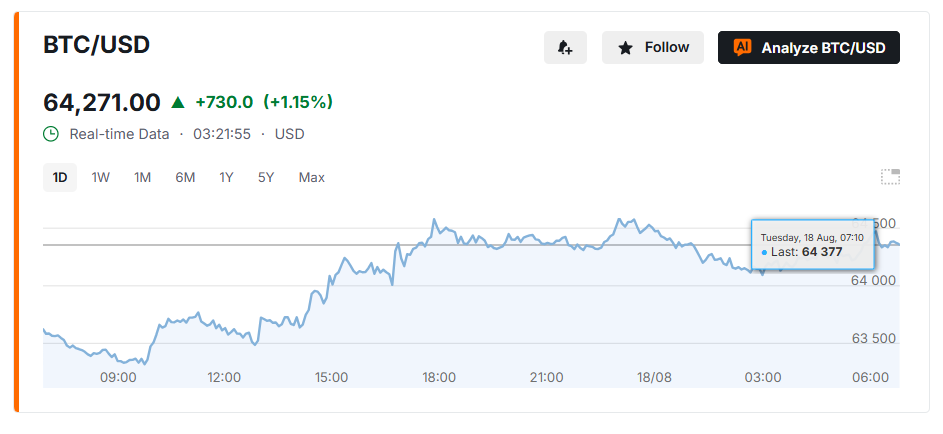
Bitcoin trades at $64,333, confined to a $2,500 range between $63,000 and $65,500. The token has stagnated after U.S. spot Bitcoin ETFs posted $389.7 million in net outflows during the week of August 10-14, reversing the prior week’s $853.5 million inflow, according to Bloomberg. Volatility has compressed sharply, and traders are watching whether the range breaks before positioning further.
Bitcoin Squeezed Into a Narrow Range
Bitcoin has traded between $63,000 and $65,500 for several sessions, with the Average True Range slipping to 0.67%, an unusually low reading that often precedes a sharp directional move. Fidelity’s FBTC led last week’s ETF exodus with a $153.2 million exit, part of the broader $389.7 million pulled from the 13 US-listed spot funds. The retreat followed hotter-than-expected inflation data, with CPI hitting 3.4% and jobless claims reaching 209,000, both of which weighed on risk appetite. The Average Directional Index reads 23.4, showing neither buyers nor sellers control the tape, which raises the odds of false breakouts before a genuine trend takes hold.
Bull and Bear Cases on the Chart
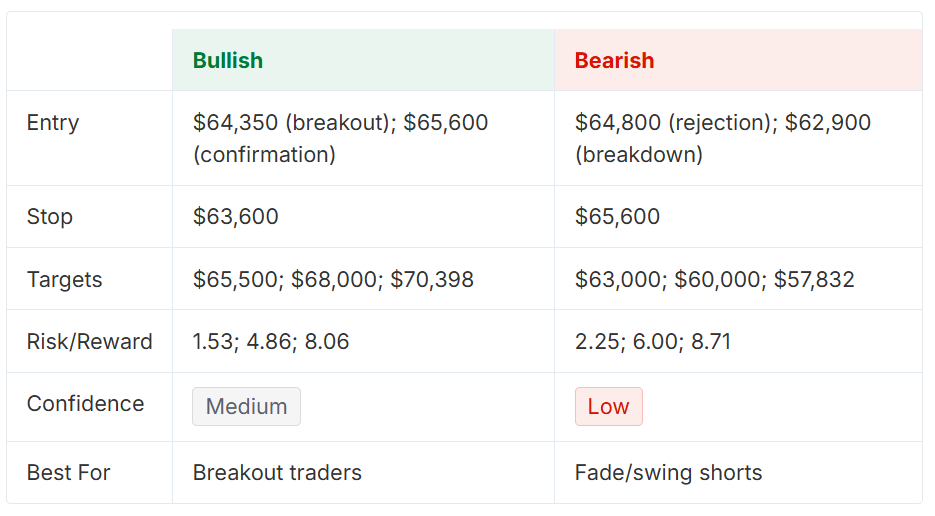
Bulls point to price holding above the 200-period simple moving average near $64,088, a green SuperTrend reading around $62,980, and bullish MACD momentum. Those signals are tempered by lower highs on longer timeframes and a Relative Strength Index near 63, indicating upside momentum is cooling as price nears resistance. Bears have not taken control. The $62,980 to $63,320 zone has absorbed selling pressure repeatedly, and only a 5-hour close below the SuperTrend line would confirm momentum has shifted toward a deeper pullback. The ETF outflows add a bearish undercurrent, but they have not been large enough to break the range.
Key Levels and Trading Discipline
Specific triggers matter more than the noise between them:
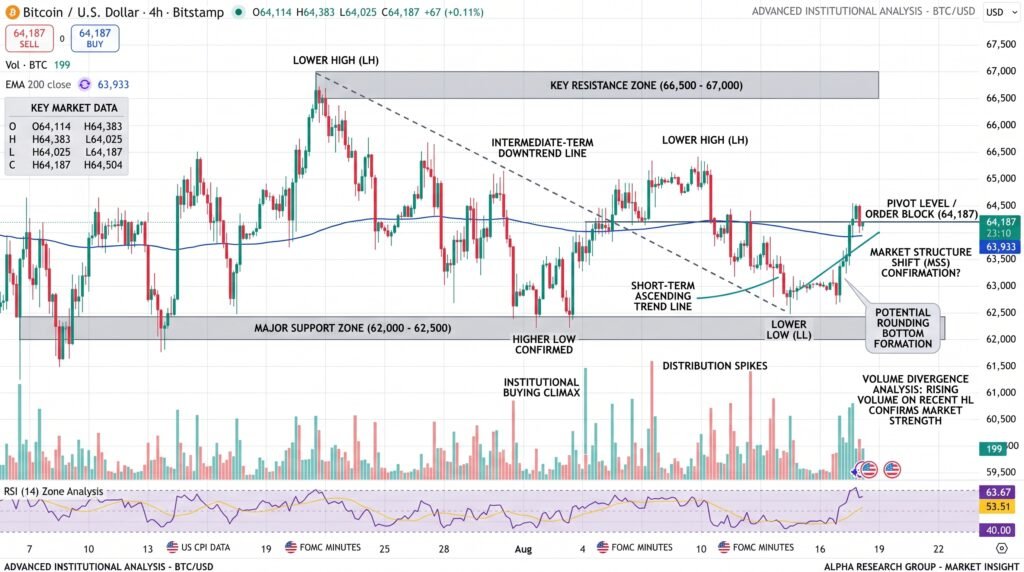
- A close above $65,600 confirms a bullish breakout, aligning with the 38.2% Fibonacci retracement and the range high.
- A close below $62,980 confirms bearish momentum, where the SuperTrend and repeatedly tested support converge.
- The $63,500 to $64,500 stretch is a no-trade zone; entries there carry poor risk-to-reward given the current chop.
What Comes Next for Bitcoin
Bitcoin’s next move depends on whether ETF flows stabilize and whether the $62,980 to $65,600 boundaries hold. With inflation data still fresh and institutional flows reversing course, the range itself has become the market’s clearest signal. A confirmed close outside it, not a guess about direction, will determine which side takes control next.
Sources & Methodology
Primary-source standard: Market-moving facts should link to original data releases, regulator notices, company filings or official project announcements whenever available. Secondary reporting is used for additional context, not as a substitute for original evidence.
Page last reviewed: