
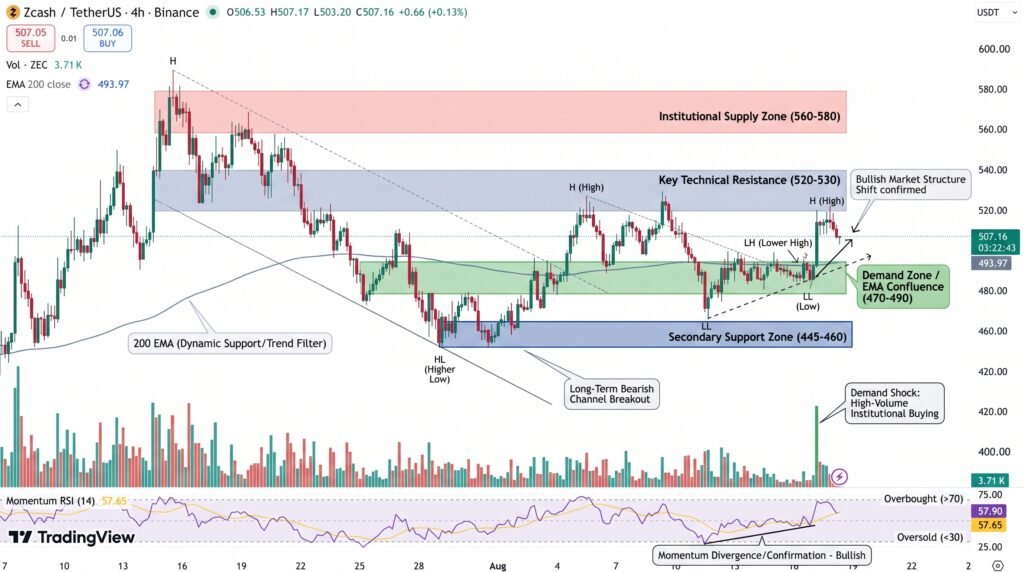
Zcash is trading near $509 after a bullish golden cross formed near $495, marking a notable technical shift following weeks of consolidation. The move follows ZEC’s erratic May-June rally, during which the token repeatedly found buyers between $460 and $480. Short-term moving averages have now crossed above the longer-term trend line, though low trading volume and resistance near $520-$525 leave the breakout unconfirmed.
Golden Cross Forms Near $495 Support
Zcash has spent several weeks consolidating following its volatile May-June rally, repeatedly finding buyers in the $460 to $480 range without giving back the full advance. That base-building has now produced a golden cross: the intermediate-term orange moving average, near $472.49, has crossed above the longer-term blue average, near $494.48. Both remain well above the long-term black moving average at $426.49, a materially healthier structure than the EMA hierarchy seen during ZEC’s earlier decline this year. Price is also holding above the short-term green average at $495.87, which puts the $494 to $496 zone in play as the first meaningful support cluster beneath current levels. As long as ZEC holds that range, the crossover has room to develop rather than fail outright.
RSI and Resistance Cap the Rally
The Relative Strength Index sits at about 54.5, only slightly above the neutral 50 mark, leaving substantial room before ZEC approaches overbought territory. That reading suggests the rally is not stretched, even after the recent push toward $509. The immediate hurdle sits between $520 and $525, a zone where Zcash has met repeated selling pressure in recent sessions. A daily close above $525 would open the path toward $550 to $575, the area where ZEC’s prior August swing high ran into resistance. Until that close happens, the setup remains a developing signal rather than a confirmed breakout.
- Support cluster: $494 to $496, reinforced by the short-term moving average
- Resistance zone: $520 to $525, the level that has repeatedly capped recent sessions
- Breakout confirmation: a daily close above $525 targets the $550 to $575 area
Volume Weakness Clouds the Breakout
Trading volume remains a weak point. Recent sessions have not come close to the participation levels seen during ZEC’s explosive May and June runs, which limits how much confidence traders can place in the current breakout attempt. A drop below $495 would not erase the golden cross itself, but it would weaken the case for near-term continuation and shift attention back to the $470 to $475 range as the next line of defense.
Conclusion: A Fragile but Real Setup
Zcash currently holds both a favorable moving-average structure and a defended price range between $470 and $500, giving ZEC its strongest technical footing in weeks. That combination does not guarantee another leg higher. Confirmation still depends on a decisive close above $525 alongside a genuine pickup in volume. Until both conditions align, the golden cross remains a developing signal rather than a settled trend.
Sources & Methodology
Primary-source standard: Market-moving facts should link to original data releases, regulator notices, company filings or official project announcements whenever available. Secondary reporting is used for additional context, not as a substitute for original evidence.
Page last reviewed: