
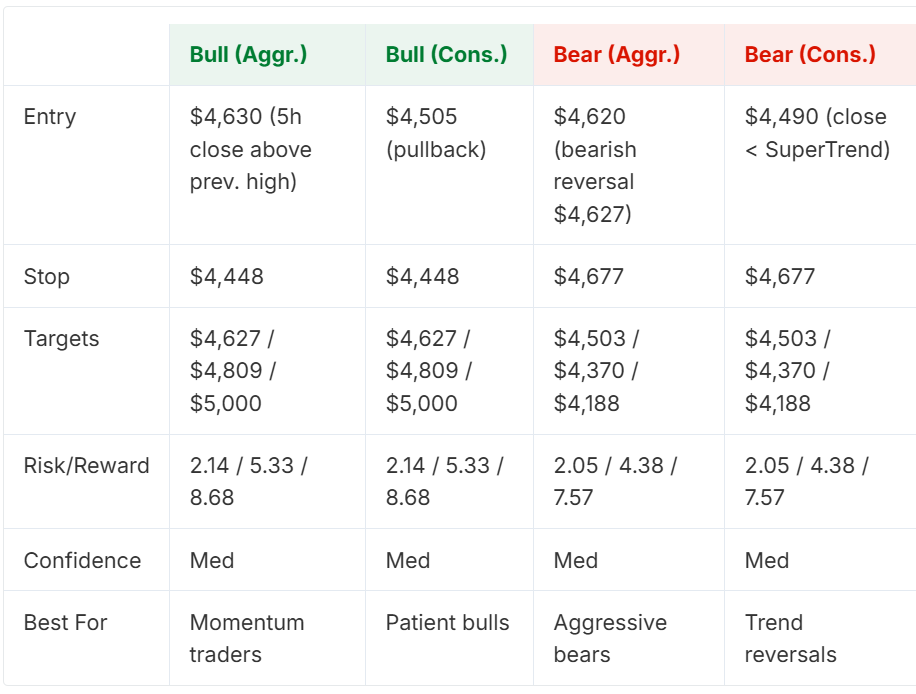
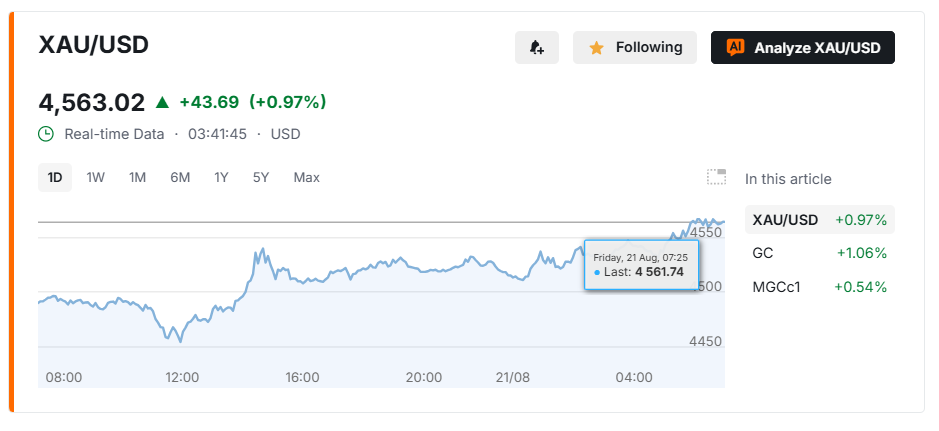
Gold (XAU/USD) trades near $4,617 on its 5-hour chart, approaching the $4,627 resistance level that marked its prior high. The Relative Strength Index reads 69.9, just under the 70 threshold that typically signals overbought conditions. Price holds above both its 200-period and 20-period simple moving averages, and the Average Directional Index stands at 41.68, indicating a strong trend. Whether gold breaks through $4,627 or reverses at this level will determine the next directional move.
Price Holds Above Key Moving Averages
Gold’s most recent 5-hour candle closed at $4,616.04, extending a run that has kept the metal above its 200-period and 20-period simple moving averages. An ADX reading of 41.68 confirms the uptrend remains structurally strong rather than weakening. The $4,627 level carries added significance because it marks the site of gold’s previous high on this timeframe, a point where earlier buying pressure stalled.
Double Top Pattern Nears Completion
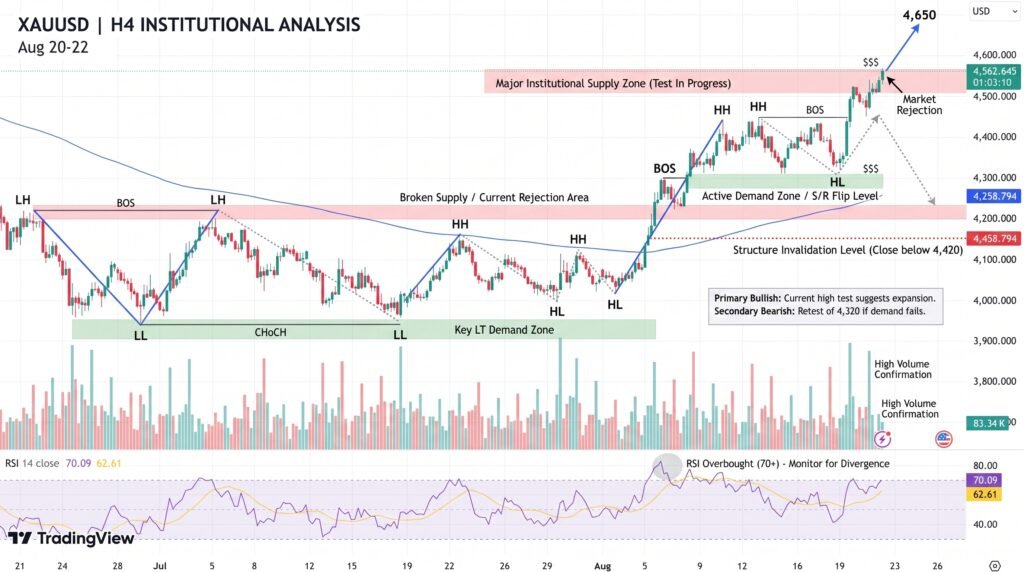
Chart data shows a potential double top forming at $4,627.10, roughly 95% complete. This pattern typically resolves through one of two outcomes: a confirmed break above the level, which would support continued gains, or a rejection at resistance, which would validate a near-term reversal. The RSI reading of 69.9 sits just below overbought territory, meaning momentum has not yet peaked but is close. Price is also trading near the upper Bollinger Band at $4,645.03, a level that has historically limited further upside without a supporting volume increase.
- Double top forming at $4,627.10, approximately 95% complete
- RSI at 69.9, below the 70 overbought threshold but rising
- Price near the upper Bollinger Band at $4,645.03
Resistance Zone Limits New Entries
The range between $4,530 and $4,627 currently offers a weak risk-to-reward setup for new positions, since price sits close enough to resistance that a reversal could erase gains quickly. A break above $4,627 without a clear increase in trading volume raises the likelihood of a false breakout, where price pushes higher briefly before reversing. Positioning for a drop before a confirmed rejection candle appears carries its own risk, since a strong uptrend can force short positions to close at a loss if price continues higher. Traders reaching an initial profit target in either direction may reduce exposure or shift stop-loss orders to breakeven while the resistance test continues.
Conclusion
Gold’s move toward $4,627 represents a direct test of a level that previously capped price gains, with RSI approaching but not yet confirming overbought conditions. The double top pattern’s near-completion and the proximity to the upper Bollinger Band both point to a decision point rather than a clear trend continuation. Confirmation, whether through a volume-backed breakout above $4,627 or a rejection candle at that level, offers a more reliable basis for a position than anticipating the outcome in advance.
Sources & Methodology
Primary-source standard: Market-moving facts should link to original data releases, regulator notices, company filings or official project announcements whenever available. Secondary reporting is used for additional context, not as a substitute for original evidence.
Page last reviewed: