
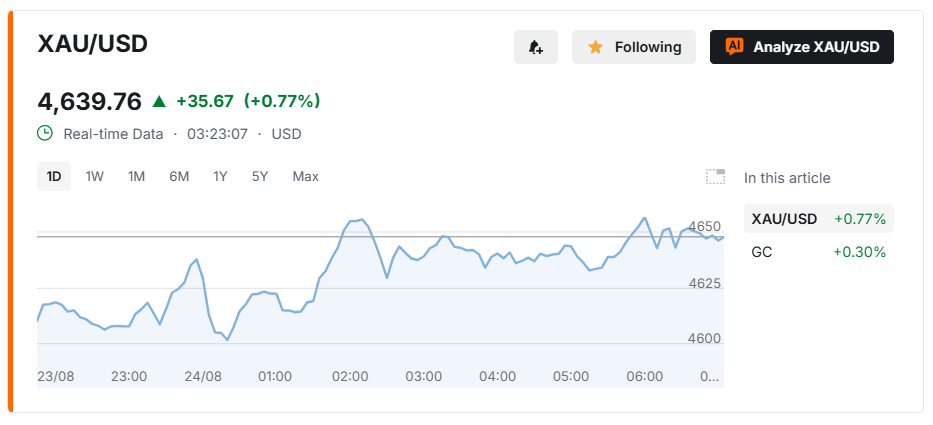
Gold climbed to $4,703.51 on Monday, extending a sharp August recovery as weaker U.S. yields, a softer Dollar and renewed concern over U.S. fiscal policy supported demand for bullion. The latest five-hour chart shows gold trading above its key short-, medium- and long-term moving averages, confirming that momentum remains positive. However, technical indicators have become increasingly stretched. The RSI stands at 76.36, while the Money Flow Index has risen to 82.50, putting both measures firmly in overbought territory and increasing the risk of consolidation or a pullback.
Gold Momentum Remains Strong
The underlying trend remains bullish despite the elevated momentum readings. According to Investing.com’s five-hour technical model, gold is trading above its 20-, 50- and 200-period moving averages. The MACD also remains positive, with the MACD line at 66.16 compared with a signal line of 53.28.
The latest technical readings include:
- Gold price: $4,703.51
- RSI: 76.36
- Money Flow Index: 82.50
- MACD: 66.16 versus 53.28
- SuperTrend support: $4,586.13
- ATR: 38.27
The Relative Strength Index is typically considered overbought when it moves above 70. That does not guarantee an immediate decline, because strong trends can remain overbought for extended periods. It does show that the pace of the rally has accelerated significantly. The Money Flow Index above 80 provides a similar warning because it combines both price and volume data.
$4,716 Becomes the Next Test
Immediate resistance sits near $4,716, according to the latest chart analysis. A sustained break above that level would confirm that buyers remain willing to absorb supply despite already elevated momentum. It is important, however, not to describe $4,716 as gold’s all-time high.
Gold reached a record near $5,595 in January 2026 before falling below $4,000 during the subsequent selloff. The latest recovery has therefore reclaimed a substantial portion of those losses but remains well below the historical peak.
Reuters reported spot gold reaching a more than three-month high above $4,643 on August 24, while U.S. gold futures approached $4,700. The rally followed a gain of more than 5% in the previous week.
The Wall Street Journal separately reported gold futures above $4,700, linking the move partly to concerns over U.S. fiscal policy and the Treasury’s expansion of long-duration bond buybacks.
$4,558 Support Matters on Pullback
The strongest near-term technical warning comes from gold’s distance above its moving averages. Investing.com’s model places the 20-period simple moving average near $4,558, meaning gold is trading roughly 3.3% above that trend measure.
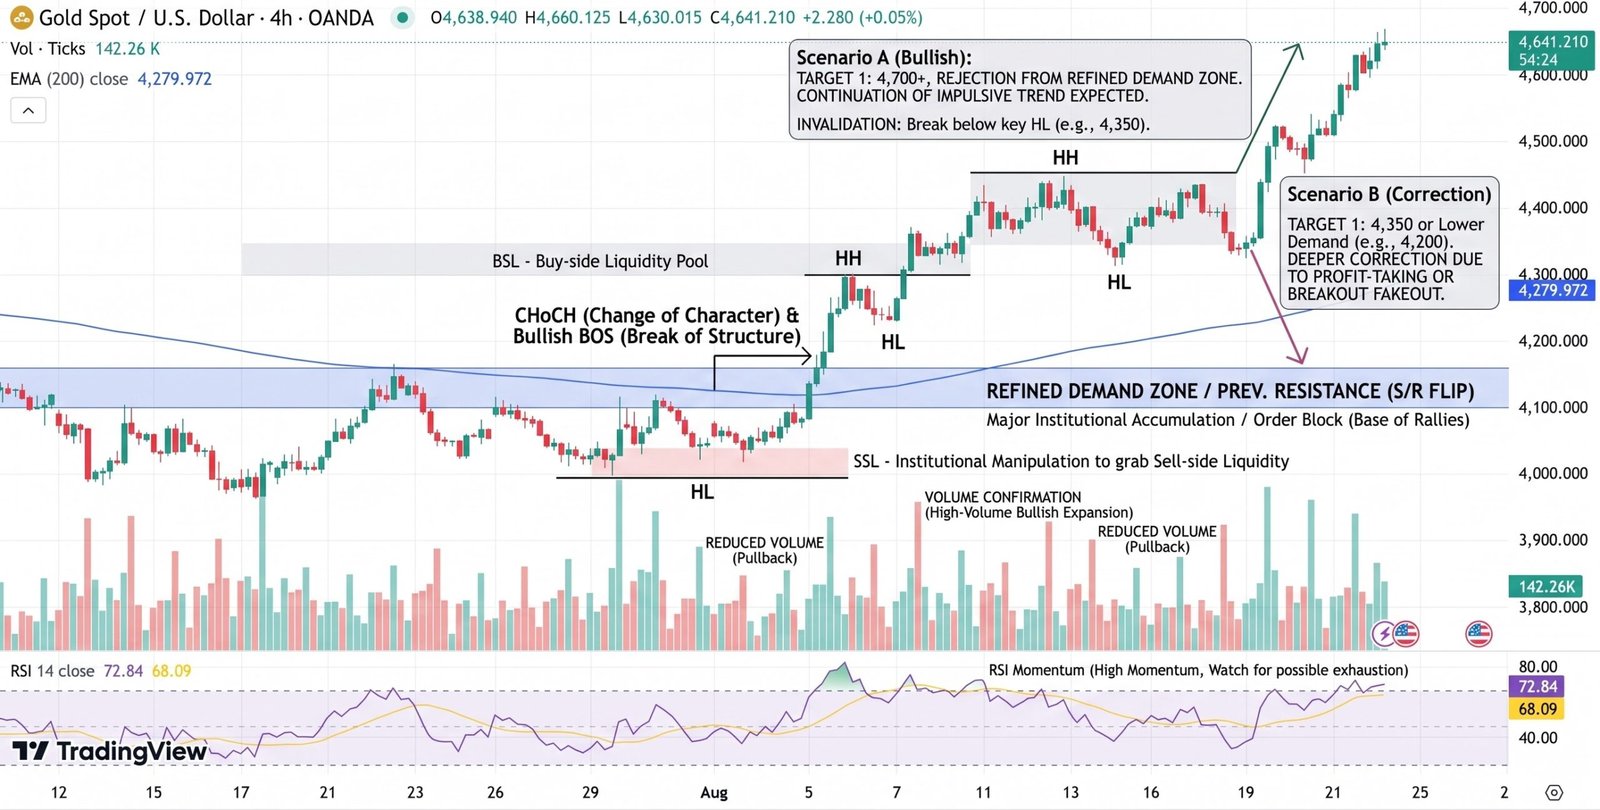
The important technical levels are:
- $4,716: Immediate resistance.
- $4,700: Psychological price level.
- $4,586: SuperTrend support.
- $4,558: 20-period SMA and deeper support.
The five-hour Average True Range stands near 38.27, implying price swings of roughly 0.8% per candle at current levels. That reflects elevated volatility and means relatively small percentage moves can translate into large dollar fluctuations.
Gold’s broader fundamental backdrop remains supportive. Reuters said the weaker Dollar and lower yields following the U.S. Treasury’s expanded bond-buyback plans helped fuel the recent advance. Investors are now focused on upcoming U.S. inflation data and Federal Reserve Chair Kevin Warsh’s Jackson Hole remarks for additional clues on the rate outlook.
Conclusion
Gold’s move above $4,700 confirms strong short-term momentum, but the technical picture is increasingly stretched. An RSI of 76.36, MFI of 82.50 and a price roughly 3.3% above the 20-period average show that buyers have pushed the market rapidly higher. The immediate test is $4,716. A sustained break would keep the recovery intact, while failure to clear resistance could shift attention toward $4,586 and $4,558. The broader trend remains supported by weaker yields and fiscal concerns, but current momentum readings argue for greater volatility rather than assuming the rally will continue in a straight line.
Sources & Methodology
Primary-source standard: Market-moving facts should link to original data releases, regulator notices, company filings or official project announcements whenever available. Secondary reporting is used for additional context, not as a substitute for original evidence.
Page last reviewed: