
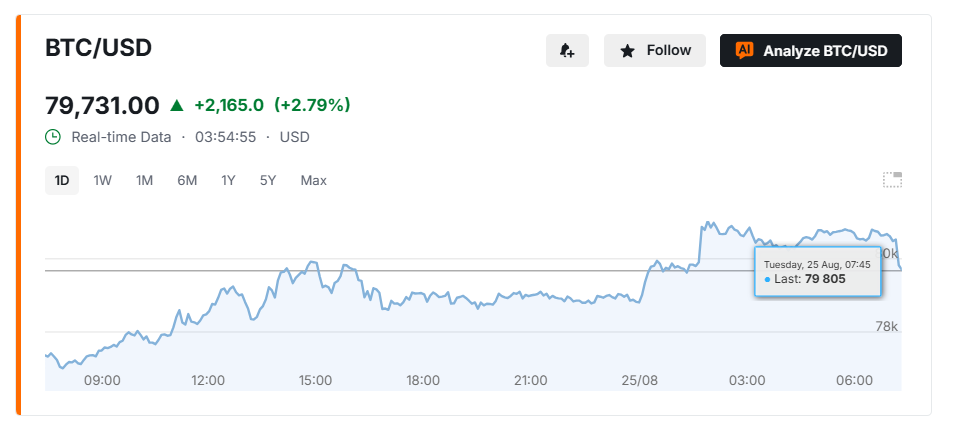
Bitcoin’s 5-hour chart closed at $80,730, pushing the token 22.2% above its 200-period moving average and outside its upper Bollinger Band. The move caps a rally that has carried BTC from the low-$60,000s to the edge of $80,000 in days, fueled by spot ETF inflows and a wave of short-position liquidations. Nearly every momentum indicator now points to exhaustion, even as the trend itself remains firmly intact.
Momentum Signals Point to Exhaustion
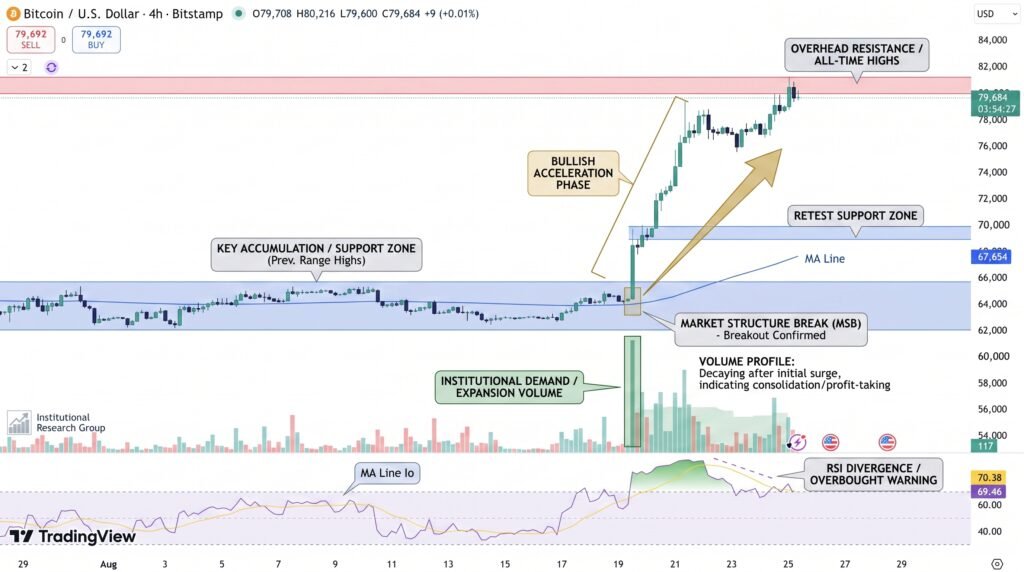
The rally’s underlying strength is not in question. The Average Directional Index sits at 64.25, a reading that confirms extreme trend strength, while SuperTrend support has climbed to $76,803.80, tracking the advance from below. Price remains above its most recent bullish continuation candle, another sign the trend hasn’t broken down.
But the same indicators that confirm the trend’s power are now flashing caution. RSI sits at 80.35 and the Money Flow Index has maxed out at 100, both classic signs of buyer exhaustion. Price trading above the upper Bollinger Band is statistically rare and typically marks overextension rather than a sustainable starting point for new gains.
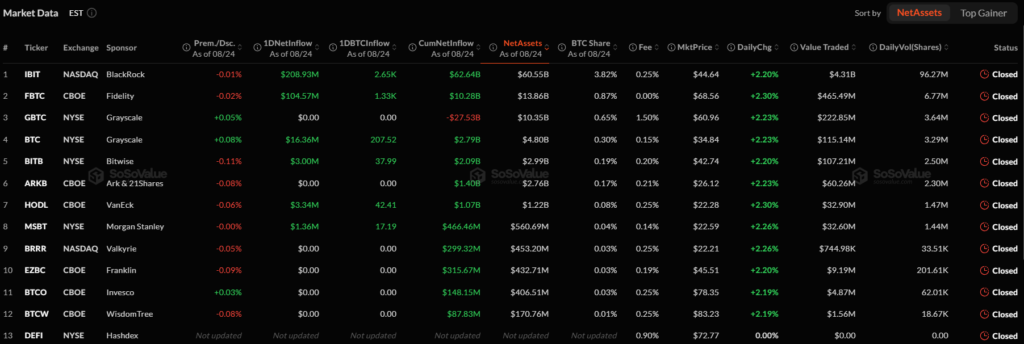
The move lines up with a broader market backdrop. US spot Bitcoin ETFs pulled in roughly $1.9 billion over five sessions through Aug. 21, their strongest weekly inflow of the year, while more than $4.3 billion in short positions were liquidated as the rally accelerated. The U.S. Treasury’s decision to double its long-term bond buyback operations has also fed the same “debasement trade” pulling money into scarce assets like bitcoin and gold simultaneously.
Key levels defining the current setup:
- No-trade zone: $77,000–$81,000, where reward for new longs is poor and shorts face a steamroller trend
- Fibonacci support: $72,286 (38.2% retracement)
- Breakout trigger: A close above $81,220–$82,000 could force short covering toward $87,581
Reading the Risk Map From Here
A parabolic advance of this shape is, by definition, a move that has already played out most of its upside in a short window; chasing it now risks becoming a late entry rather than catching fresh momentum. Above $81,220, traders should watch for bullish exhaustion reversals, the kind of blow-off top pattern that often marks a cycle high before a sharper pullback.
For momentum traders still positioned, RSI dropping back below 70 is typically the first technical warning that buying pressure is fading. Volume remains high, which confirms heavy participation, but with the rally already stretched, the pool of fresh buyers willing to chase price higher is shrinking.
Given the whipsaw risk on both sides of this trade, stop placement and position sizing matched to current volatility matter more than usual, for bulls chasing continuation and bears betting on a reversal alike.
Conclusion
Extreme moves like this one don’t sustain indefinitely, even in a market as volatility-tolerant as crypto. The setup rewards discipline over urgency: traders not already positioned may find a clearer, higher-conviction entry by waiting for volatility to cool and price to retest support rather than chasing the current extension.
Sources & Methodology
Primary-source standard: Market-moving facts should link to original data releases, regulator notices, company filings or official project announcements whenever available. Secondary reporting is used for additional context, not as a substitute for original evidence.
Page last reviewed: