
The Japanese Yen trades broadly flat against the U.S. Dollar at around 156.00 at the start of the week, keeping USD/JPY close to its four-month low of 155.23. The pair remains under pressure after the yen recorded strong gains last week, driven by hawkish commentary from Bank of Japan board member Hajime Takata.
The sharp yen appreciation has pushed USD/JPY substantially lower from recent highs, leaving traders focused on whether the pair can break below the key 155.00 psychological level.
BoJ signals strengthen yen outlook
MUFG highlighted the scale of the recent currency move, noting that the Japanese yen strengthened from around 160.00 on September 2 to as low as 155.30, representing a move of roughly five big figures in a short period.
The bank linked the move primarily to the changing policy backdrop. BoJ board member Hajime Takata, considered one of the central bank’s more hawkish policymakers, recently left the door open to an outsized interest-rate increase and back-to-back hikes if economic conditions warrant a faster tightening cycle.
The comments have strengthened expectations that the BoJ could pursue a more aggressive normalization path. At the same time, broader U.S. dollar weakness and gains across regional currencies have contributed to USD/JPY’s decline.
MUFG also addressed speculation about possible foreign-exchange intervention, saying it was not entirely clear whether intervention had contributed to the move. However, the bank noted that BoJ current-account data due Wednesday did not suggest the decline was driven by intervention, instead pointing toward broader dollar weakness and regional foreign-exchange gains.
Investors now await the August U.S. CPI report, due Friday, which could significantly influence Federal Reserve interest-rate expectations.
- USD/JPY: Around 156.00
- Four-month low: 155.23
- Recent move: 160.00 to 155.30
- U.S. CPI: Due Friday
- BoJ focus: Potential outsized and back-to-back rate hikes
155.25 support holds the key
The technical outlook remains bearish. On the daily chart, USD/JPY trades around 155.95, well below its 100-day Simple Moving Average at 159.92. The wide gap between spot and the moving average shows that sellers currently retain control of the near-term trend.
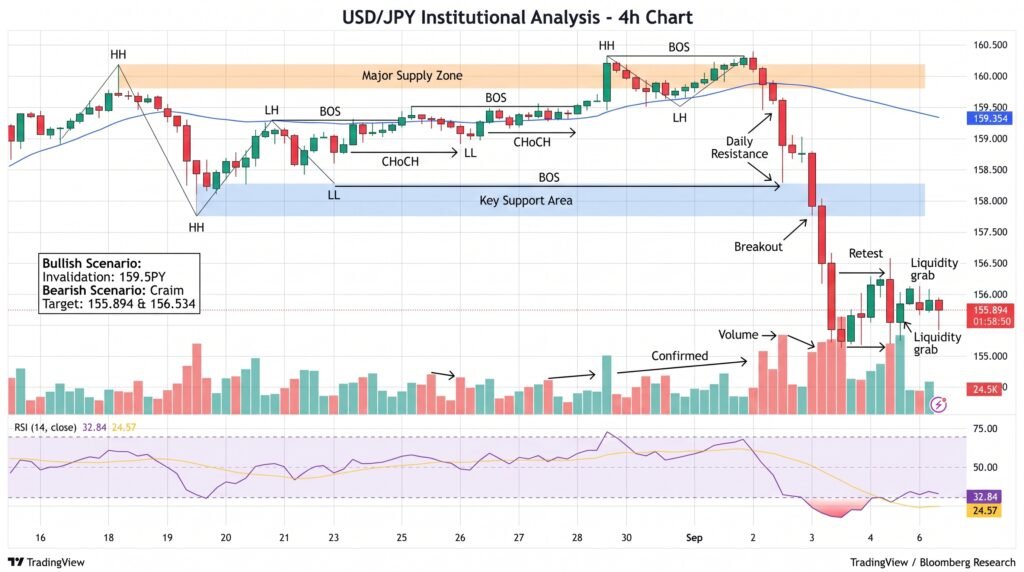
USD/JPY Price Chart – Source: Tradingview
The Relative Strength Index (RSI) is around 32, just above oversold territory. This indicates that downside momentum remains strong but is becoming stretched, meaning the pair could become vulnerable to a short-term rebound if selling pressure eases.
Key technical levels include:
- Resistance: 159.92, the 100-day SMA
- Immediate support: 155.25
- Four-month low: 155.23
- Psychological level: 155.00
- RSI: Around 32
A decisive break below 155.25 could confirm a fresh downside leg and expose USD/JPY to further losses below 155.00. Conversely, a sustained recovery above 159.92 would ease the bearish pressure and provide bulls with a stronger technical signal.
Conclusion
USD/JPY remains under pressure near 156.00 as hawkish Bank of Japan expectations strengthen the Japanese Yen and keep the pair close to its four-month low. The 155.25 support zone is now critical, with a decisive break below it potentially triggering a fresh downside leg under 155.00. Meanwhile, Friday’s U.S. CPI report could become the next major catalyst by reshaping expectations for the Federal Reserve’s interest-rate path.
Sources & Methodology
Primary-source standard: Market-moving facts should link to original data releases, regulator notices, company filings or official project announcements whenever available. Secondary reporting is used for additional context, not as a substitute for original evidence.
Page last reviewed: