
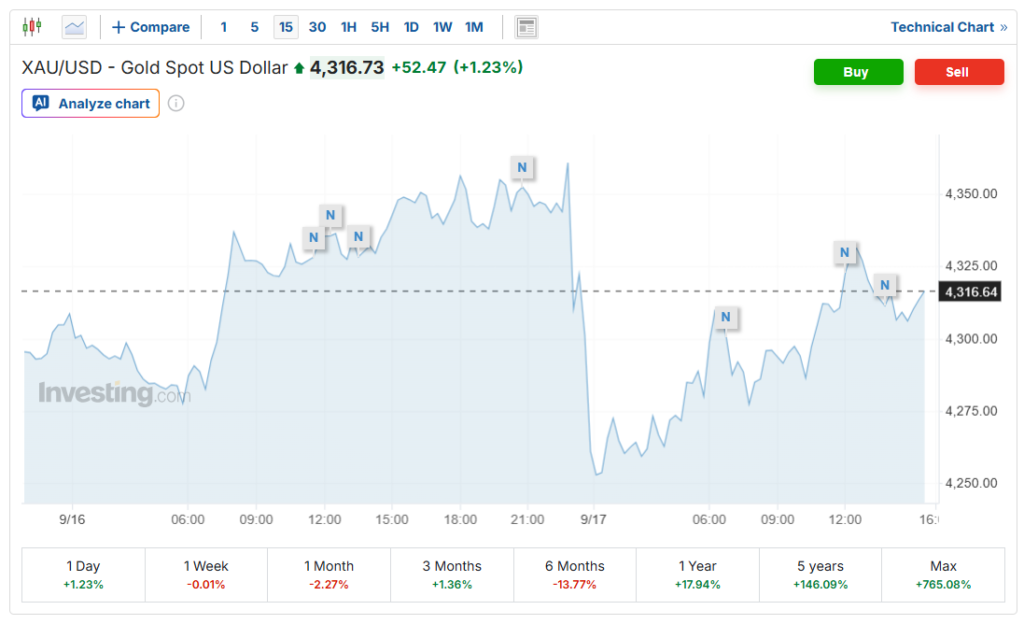
Gold’s technical structure remains under pressure after a sharp retreat from recent highs, with the supplied 5-hour chart snapshot showing price at $4,357.45 and facing a dense resistance zone near $4,410-$4,435. The market has rebounded from the $4,273 area, but the recovery has not yet changed the broader bearish setup. Meanwhile, the latest verified spot-market data put gold around $4,295 on September 17 after the Federal Reserve raised rates and signaled another possible increase before year-end.
Gold Rebound Meets Heavy Resistance
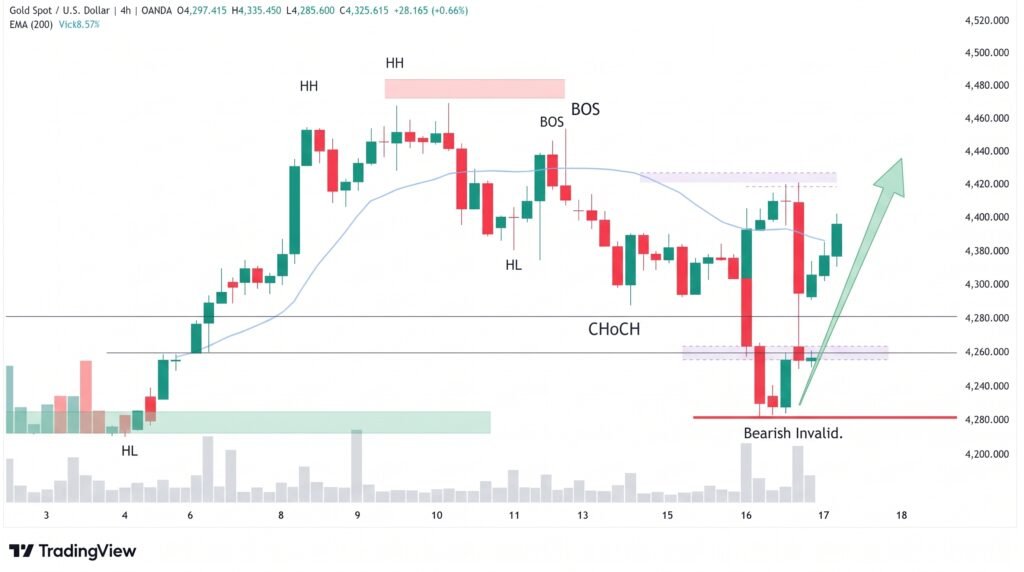
The chart setup shows gold recovering from the $4,273 region after a bullish hammer formed near support. However, price remains below the key moving averages and trend indicators, keeping the broader structure bearish.
The main resistance area sits around $4,410-$4,435, where the 50-period SMA, SuperTrend and the lower portion of the Ichimoku Cloud converge. A sustained break through this area would be required to weaken the current bearish structure.
The Federal Reserve’s latest decision has added pressure to non-yielding assets. On September 16, the Fed raised its policy rate by 25 basis points to 3.75%-4.00%, while officials signaled that further tightening could follow. U.S. Treasury yields also climbed, creating an additional headwind for gold.
- Chart snapshot price: $4,357.45
- Major resistance: $4,410-$4,435
- Key support: $4,260-$4,280
- Recent rebound zone: Around $4,273
Momentum Shows Mixed Signals
Gold’s short-term momentum is less one-sided than the broader trend. The MACD line has moved above its signal line, creating a modest bullish crossover, although both remain below zero. That means the rebound has improved short-term momentum without yet establishing a confirmed trend reversal.
The Relative Strength Index (RSI) near 46.9 has also recovered from oversold territory. The indicator remains below the neutral 50 mark, however, suggesting that buyers have not yet gained control.
The falling-wedge structure is another factor worth monitoring. Such formations can precede bullish reversals, but the pattern requires confirmation. In this setup, a convincing move above roughly $4,440 would provide stronger evidence that buyers are breaking the sequence of lower highs.
On the downside, the $4,260-$4,280 region remains the most important support band. A decisive break below it would reinforce the bearish structure and expose the metal to another leg lower.
Fed Policy Shapes Gold’s Next Move
The Federal Reserve’s September rate decision has become a major driver for gold. The central bank said inflation remains elevated and raised rates to support a faster return toward its 2% objective. Its projections also showed policymakers expecting another increase during 2026.
Higher rates can raise the opportunity cost of holding gold because the metal does not provide an interest payment. The stronger dollar and rising Treasury yields can add further pressure.
Reuters reported that gold nevertheless gained 0.8% to $4,295.26 on Thursday as traders digested the Fed decision, while December gold futures fell 1.2% to $4,333.90. The divergence highlights the importance of separating the supplied technical chart snapshot from the latest spot-market price.
For the technical setup, $4,410-$4,435 is the principal upside barrier, while $4,260-$4,280 remains the key support zone.
Conclusion:
Gold remains in a bearish technical regime despite its rebound from the $4,273 area. The $4,410-$4,435 resistance cluster is the critical test for any sustained recovery, while $4,260-$4,280 defines the immediate downside zone. MACD has improved and RSI has recovered from oversold conditions, but neither indicator has confirmed a broader reversal. With the Fed maintaining a restrictive stance, gold’s next decisive move will depend on whether buyers can reclaim the resistance wall or sellers regain control below support.
Sources & Methodology
Primary-source standard: Market-moving facts should link to original data releases, regulator notices, company filings or official project announcements whenever available. Secondary reporting is used for additional context, not as a substitute for original evidence.
Page last reviewed: