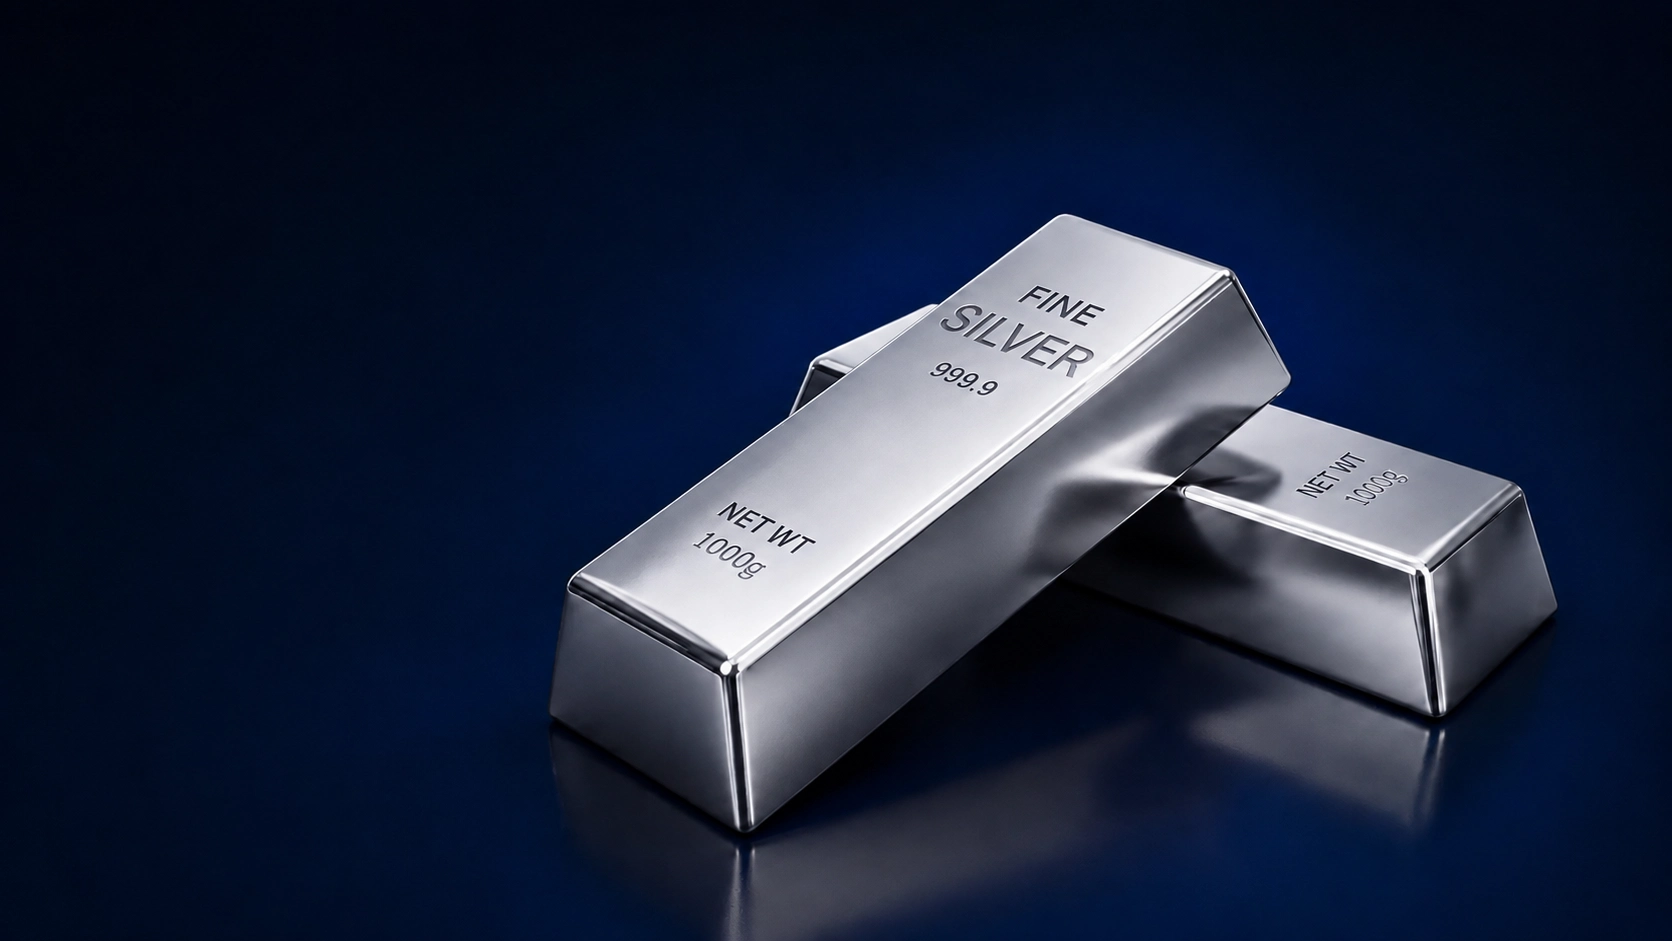
Silver is struggling to establish a clear direction after slipping beneath a key resistance cluster. On the five-hour chart, XAG/USD is around $64.43, with buyers facing resistance between $64.88 and $65.67.
The setup leaves silver between a nearby technical floor and a heavy ceiling. Price is close to the 200-period simple moving average around $64.26, but the broader five-hour structure has not produced enough momentum to confirm a sustained recovery.
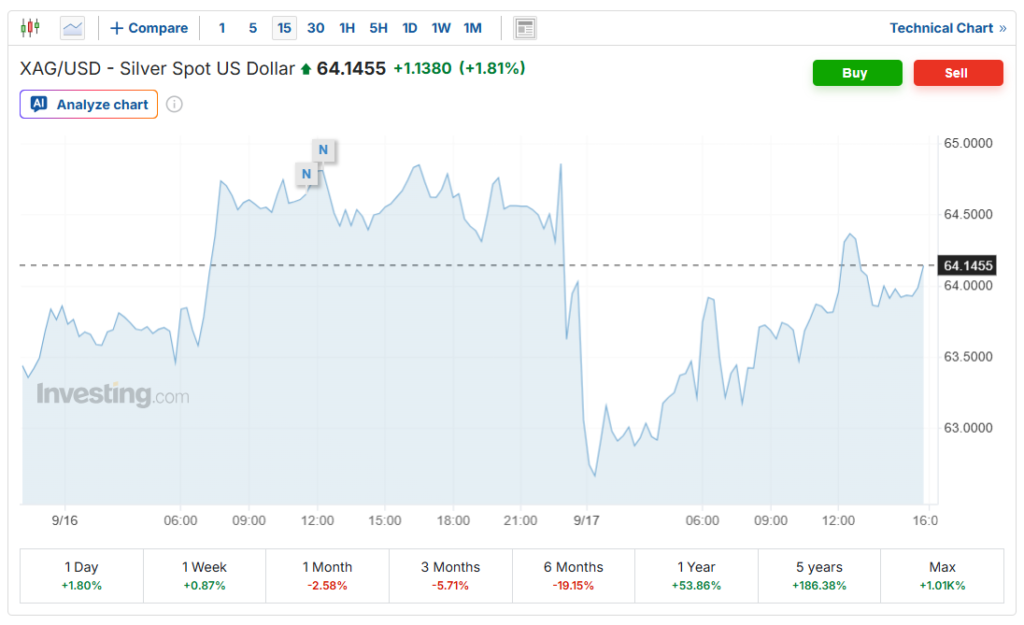
The wider precious-metals market is also dealing with a more restrictive U.S. monetary-policy backdrop. The Federal Reserve raised its policy rate by 25 basis points at its latest meeting, taking the target range to 3.75%-4.00%. Higher rates can weigh on assets such as silver that do not generate interest income.
Resistance Keeps Buyers Contained
The immediate technical challenge is the $64.88-$65.67 zone. It combines several reference points, including the lower edge of the Ichimoku cloud and the 50-period moving average in the supplied five-hour setup.
A sustained move above this area would change the short-term structure by taking price out of its current resistance band. However, an isolated move above $65.67 would not automatically confirm a breakout. Traders would need to see follow-through and stronger participation.
Momentum indicators currently offer limited confirmation. The RSI at 46.74 sits below the neutral 50 threshold, indicating that neither buyers nor sellers have established strong control. The MACD is recovering from bearish territory, but the improvement has not yet translated into a decisive price move.
Key technical levels remain:
- Immediate support: $63.10
- Major support: $62.75
- First resistance: $64.88
- Major resistance: $65.67
- Potential upside: Above $66 if resistance breaks
Volume is another important variable. Declining activity during consolidation reduces the reliability of short-lived moves through resistance.
$62.75 Defines Downside Risk
The lower part of the range is becoming increasingly important. A sustained break below $63.10 would weaken the current consolidation structure, while a move below $62.75 would provide a clearer bearish signal.
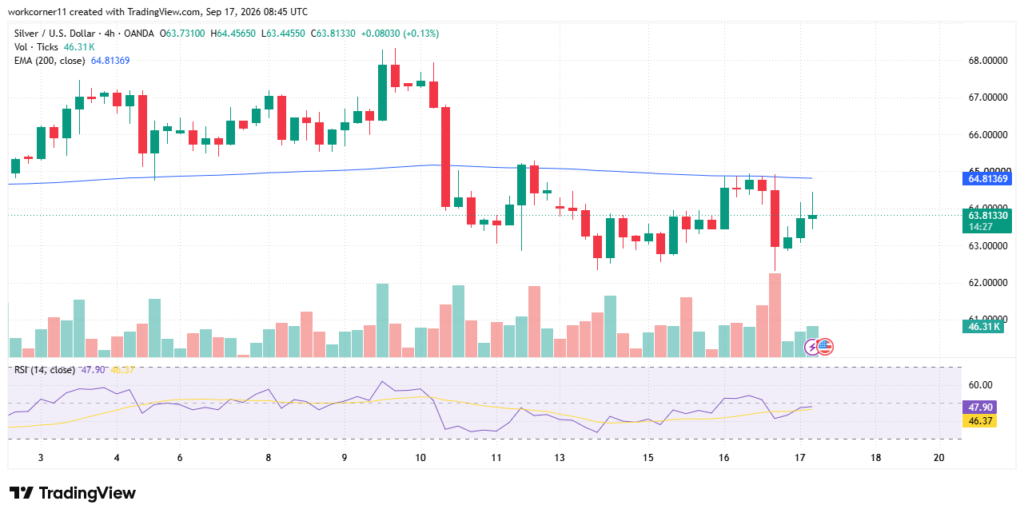
The five-hour ATR is around $1.05, equivalent to approximately 1.63% of the current price. That indicates that daily fluctuations of around $1 are consistent with the recent volatility profile and should be considered when assessing short-term price moves.
Silver’s recent market behavior also shows why the $64-$66 region requires confirmation. The metal has experienced sharp intraday swings, while broader precious-metals markets remain sensitive to interest-rate expectations, the U.S. dollar and geopolitical developments. Current reporting shows silver gaining alongside other precious metals on September 17 despite the Fed’s rate increase, illustrating the competing forces affecting the market.
A move above $65.67 would place $66 back into focus, while a failure at resistance followed by a break under $62.75 would reinforce the bearish technical structure.
Conclusion:
Silver remains caught between $62.75 support and $65.67 resistance, with $64.43 sitting near the middle of the key technical range. The RSI remains neutral-to-weak and volume has not provided strong confirmation for a breakout. Buyers need a sustained move above $65.67 to establish stronger upside momentum, while sellers would gain clearer control below $62.75. Until one of those boundaries breaks with follow-through, XAG/USD remains vulnerable to further range-bound trading and false moves.
Sources & Methodology
Primary-source standard: Market-moving facts should link to original data releases, regulator notices, company filings or official project announcements whenever available. Secondary reporting is used for additional context, not as a substitute for original evidence.
Page last reviewed: