
XRP is consolidating near $1.50 after falling 4.54% on Wednesday, according to historical market data. XRP closed near $1.50 on September 23 after reaching an intraday high of $1.66, extending a pullback from its recent rally.
The correction follows a sharp advance earlier in the week. XRP gained 8.90% on September 21 and another 2.35% on September 22 before sellers returned. The retreat has not yet broken the broader technical structure described in the supplied analysis, with price remaining above major exponential moving averages.
Whale Buying and ETF Demand
On-chain data continues to provide evidence of increased activity around XRP. Santiment’s XRP data tracks wallet distribution, network growth and whale transactions across the XRP Ledger. Santiment also highlighted a sharp increase in XRP activity as the token moved above $1.60 earlier this week.
The supplied data shows wallets holding between 10 million and 100 million XRP and those holding 100,000 to 1 million XRP accumulated a combined 350 million tokens since Sunday. Holders of 1 million to 10 million XRP, meanwhile, reduced their holdings by about 50 million tokens.
Institutional flows have also remained positive:
- XRP spot ETFs attracted $18.04 million on September 23.
- The previous session recorded $20.02 million of net inflows.
- Bitwise accounted for $11.54 million of the latest daily inflow.
These flows indicate continued demand from regulated investment products, although ETF inflows alone do not guarantee sustained price appreciation.
XRP Technical Levels to Watch
XRP remains above the 50-day, 100-day and 200-day EMAs cited in the technical setup, positioned at approximately $1.331, $1.284 and $1.361, respectively. The grouping of these averages below price provides several reference points if the correction deepens.
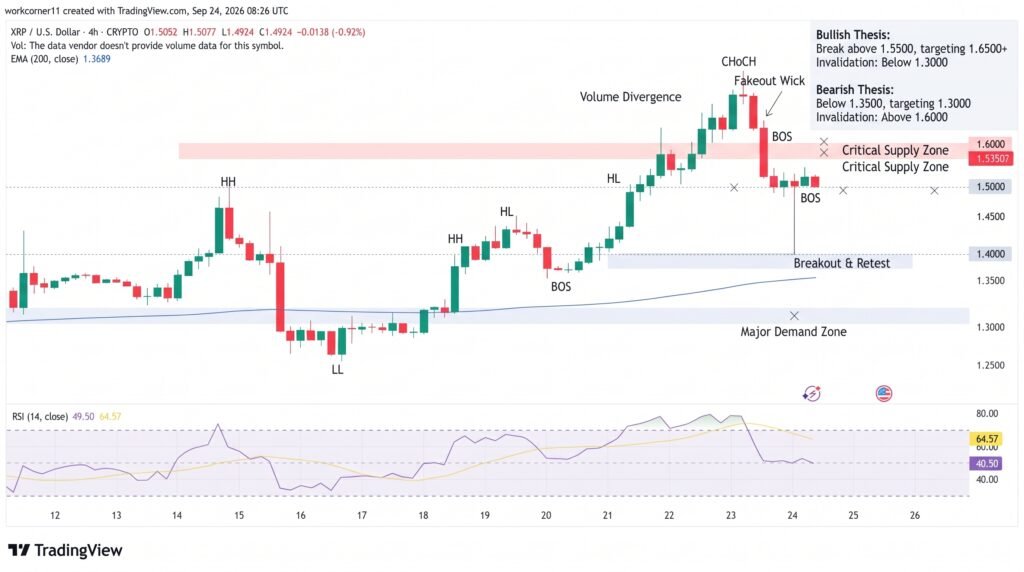
The daily Relative Strength Index (RSI) is around 60, indicating positive momentum without reaching traditional overbought territory. The MACD remains positive, with its line above the signal line and a modestly positive histogram.
Immediate support is around $1.506, followed by the 200-day EMA near $1.361 and the 50-day EMA at $1.331. The $1.300 area provides another important reference, while a deeper decline could expose $1.284 and eventually the $1.00 region.
On the upside, $1.900 remains the major horizontal resistance level in the supplied technical structure. A sustained move toward that area would require XRP to regain momentum after the recent correction.
Conclusion
XRP’s retreat toward $1.50 comes after a rapid multi-session advance, but current data shows continued ETF demand and elevated on-chain activity. The $1.506 area is the first technical level to monitor, while the $1.361 and $1.331 EMAs provide deeper support references. A recovery toward $1.90 would require renewed buying pressure and stronger momentum, while a sustained break below the key EMA cluster would weaken the current structure.
Sources & Methodology
Primary-source standard: Market-moving facts should link to original data releases, regulator notices, company filings or official project announcements whenever available. Secondary reporting is used for additional context, not as a substitute for original evidence.
Page last reviewed: