
Bitcoin is holding inside a narrow $82,800-$85,000 range, with the supplied 5-hour chart placing price near $84,186. The market has entered a period of consolidation after Bitcoin reached a recent September high of $87,363.20 on Sept. 21. Investing.com historical data shows BTC subsequently trading between roughly $82,600 and $85,600 during several sessions, while current October 1 feeds are closer to the $83,500 area. The compressed range leaves traders focused on the next decisive move.
Bitcoin Momentum Stalls Near $85,000
The 5-hour technical structure shows BTC/USD trading between its 50-period simple moving average at $84,301 and SuperTrend support near $83,266. That positioning reflects a market that has lost short-term direction after the September advance.
The broader structure remains constructive while price stays above the 200-period SMA at $79,796, but the shorter-term signals have weakened. Bitcoin is below its 50-period average, while the Average Directional Index (ADX) is only 15.9. ADX readings at such levels generally indicate a weak trend rather than strong directional momentum.
The MACD is approaching a potential bullish crossover, but price action has not yet confirmed a stronger advance. Lower highs near $85,000 show that sellers are still active around the upper boundary. At the same time, declining volume suggests participation has eased while the market waits for a catalyst.
Bitcoin Support and Resistance Levels
The main technical battle remains between $82,800 support and $85,000 resistance. A break outside that band would provide a clearer signal than the recent back-and-forth trading.
- $82,800: Immediate Bitcoin support.
- $85,000: Key Bitcoin resistance.
- $82,650: 38.2% Fibonacci retracement level.
- $81,194: 50% Fibonacci retracement.
- $79,738: 61.8% retracement near the 200-SMA zone.
The $84,115 doji highlighted in the chart also points to indecision, while the $83,500-$84,500 area remains vulnerable to rapid reversals. A sustained close above $85,000 with stronger volume would improve the short-term momentum picture. A close below $82,800, particularly alongside a rising ADX, would put $81,194 and $79,738 back in focus.
What Bitcoin Traders Should Watch
The range has become increasingly important because Bitcoin has not yet established a fresh direction after its September surge. The recent market data confirms repeated tests of the broader $82,800-$85,000 zone, including a September 30 session that reached $85,608.93 on the high and $82,927.36 on the low.
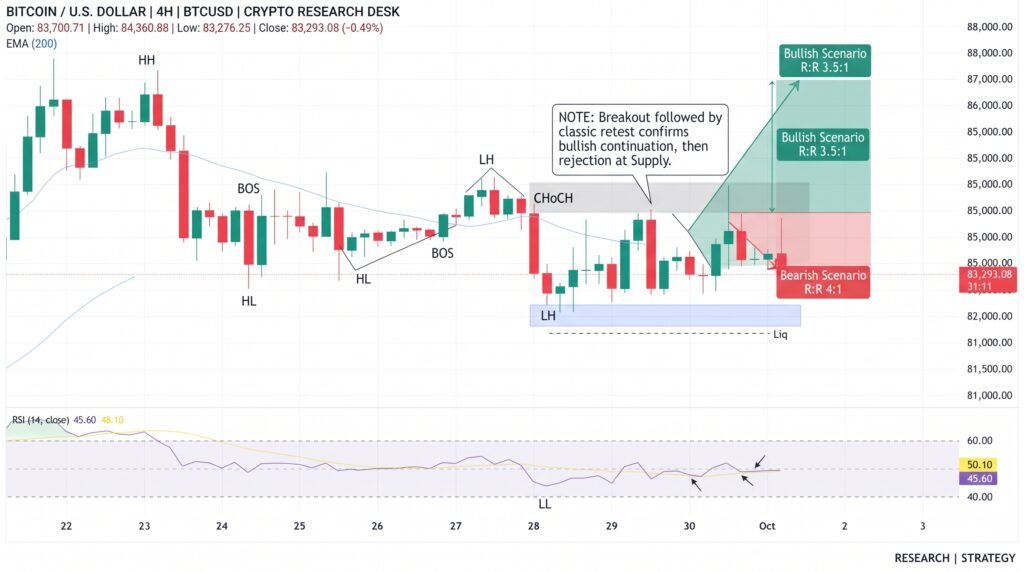
Volume will be important in distinguishing a genuine breakout from a short-lived move. A move above $85,000 supported by expanding activity would place the $87,363.20 September high back on the chart. A breakdown through $82,800 would instead expose the lower Fibonacci levels.
Conclusion
Bitcoin remains compressed between $82,800 and $85,000, with the 50-SMA, SuperTrend and momentum indicators reflecting a market in transition. The 200-SMA near $79,796 continues to mark the broader technical reference, while $81,194 and $79,738 become important downside levels if support fails. Until BTC closes decisively outside the range, the price action remains defined by consolidation rather than a confirmed new trend.
Sources & Methodology
Primary-source standard: Market-moving facts should link to original data releases, regulator notices, company filings or official project announcements whenever available. Secondary reporting is used for additional context, not as a substitute for original evidence.
Page last reviewed: