
Brent crude oil traded near $106.18 on the five-hour chart, consolidating below the $107 resistance level as bullish momentum weakened. Although prices remain above key moving averages and the Ichimoku Cloud, technical indicators suggest that buying pressure may be losing strength. The market is approaching a critical decision point, with a confirmed breakout potentially extending the rally and a decline below support increasing the risk of a deeper correction. Traders are watching momentum, trading volume and trend strength for confirmation.
Brent Oil Momentum Weakens Near $107
Brent’s broader technical structure remains constructive, with prices holding above key moving averages and the Ichimoku Cloud. However, the latest readings suggest that the market’s upward momentum is less convincing as crude approaches resistance.
The Moving Average Convergence Divergence (MACD) has turned negative, signaling weakening short-term momentum. This development does not guarantee a decline, but it raises the possibility that buyers may struggle to push prices through the $107 barrier.
The Money Flow Index (MFI) stands at 87.12, well above the commonly used overbought threshold of 80. The reading indicates strong recent buying pressure, but it can also warn that prices have advanced too quickly and may be vulnerable to profit-taking.
Meanwhile, the Average Directional Index (ADX) is just 9.22. Since ADX measures trend strength rather than direction, such a low reading suggests that the current move lacks a strong directional trend. Brent could therefore remain volatile within its existing range before a clearer breakout emerges.
Brent Crude Price Forecast: Key Levels
The immediate trading range lies between $104.65 and $107.00. Repeated failures near the upper boundary could encourage selling, while support at the lower boundary will be important for buyers attempting to preserve the broader bullish structure.
A sustained break above resistance would need confirmation from stronger trading activity and an improving ADX reading. Without those signals, an initial move higher could fail and return prices to the range.
The main technical levels are:
- $107.00: Immediate resistance and the upper edge of the current range.
- $107.50: Breakout confirmation level for bullish traders.
- $104.65: Initial support; a break below it would weaken the near-term outlook.
- $102.40: Potential downside target if selling accelerates.
- $101.23: Important Fibonacci retracement level that coincides with the lower Ichimoku Cloud boundary in the supplied analysis.
The $101.23 zone is particularly important because a sustained decline toward it would put the broader bullish structure under greater pressure.
Brent Oil Outlook: Breakout or Pullback?
Brent’s next move depends on whether buyers can overcome $107 resistance or sellers force a break below $104.65. A move above $107.50, supported by stronger volume and improving trend strength, would strengthen the bullish case. Failure to secure that breakout could leave the market vulnerable to another reversal.
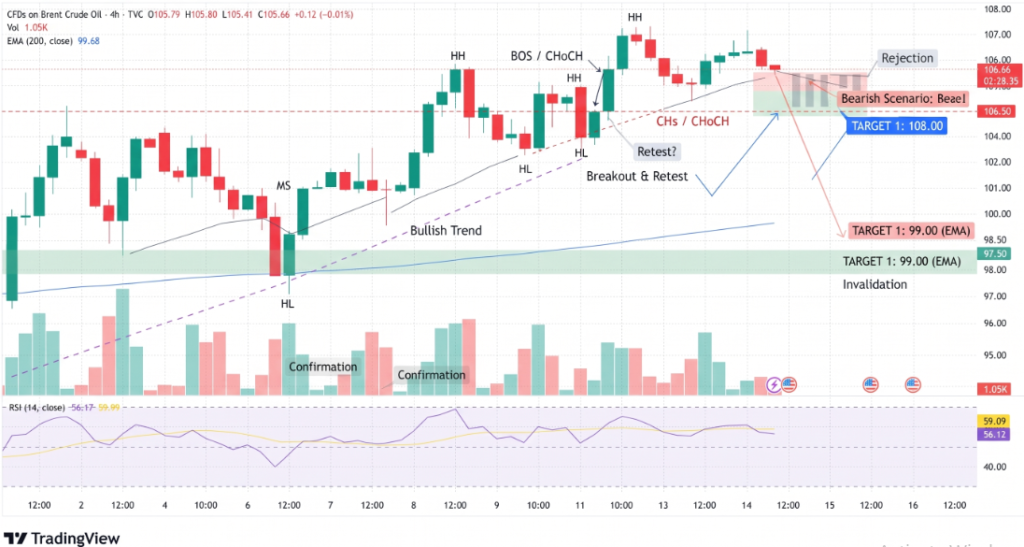
On the downside, a confirmed break below $104.65 would put $102.40 in focus, with $101.23 offering a deeper technical reference. Until either boundary breaks decisively, price movements within the range may produce false signals.
Conclusion:
Brent crude remains supported by its broader bullish structure, but weak ADX readings, a negative MACD and an overbought MFI point to elevated uncertainty near $107. Traders will need confirmation before treating either direction as a sustained move. A breakout above $107.50 could extend gains, while a drop below $104.65 would increase downside risks.
Sources & Methodology
Primary-source standard: Market-moving facts should link to original data releases, regulator notices, company filings or official project announcements whenever available. Secondary reporting is used for additional context, not as a substitute for original evidence.
Page last reviewed: