
Natural gas climbed to $3.321 on the supplied five-hour chart, approaching the upper Bollinger Band as signs of near-term buying exhaustion emerged. The Money Flow Index (MFI) reached 86.99, while a spinning-top or doji-style candle near $3.333 suggested hesitation after the latest advance. The broader trend remains bullish, but stretched momentum raises the possibility of a pullback. Traders are now watching whether buyers can push prices above $3.350 or whether support levels will come under pressure as investors take profits.
Natural Gas Rally Shows Overbought Signs
The latest advance has carried natural gas nearly 4% above its 20-period moving average, according to the supplied chart. That distance signals a sharp short-term move and increases the market’s sensitivity to profit-taking. The upper Bollinger Band provides additional context: prices approaching or moving beyond this band can indicate strong momentum, but they can also reflect an unusually extended move.
The MFI reading of 86.99 is particularly notable. This indicator combines price and volume to estimate buying and selling pressure, with readings above 80 commonly considered overbought. Such a reading does not guarantee a decline, however. Prices can remain elevated when demand is strong, making confirmation from subsequent candles important.
The reported spinning-top or doji-style candle around $3.333 adds another cautionary signal. These formations indicate that buyers and sellers struggled to establish control during the candle period. After a steep rally, that hesitation may precede consolidation or a reversal, although further price action is needed to confirm either outcome.
Key Support and Resistance Levels
The immediate test is whether natural gas can sustain its advance beyond $3.333 and clear resistance around $3.350. A convincing move above that threshold would suggest buyers remain in control despite overbought conditions. Failure to break higher could leave the market vulnerable to a retreat toward nearby support.
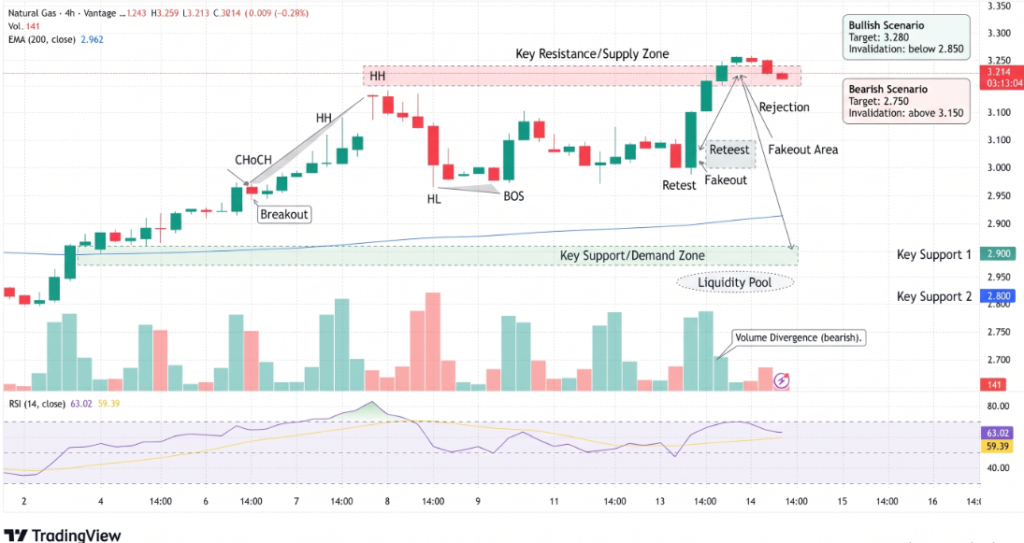
The supplied chart identifies $3.164 as SuperTrend support, with a deeper potential buying area between $3.197 and $3.172. The 50-period moving average sits at $3.118, providing another reference point if selling accelerates.
Traders are monitoring several levels:
- $3.350: A sustained break could extend the bullish move.
- $3.300–$3.316: Nearby resistance where sellers may emerge.
- $3.197–$3.172: Potential support during a pullback.
- $3.164: SuperTrend level; a close below it would weaken the bullish setup.
- $3.118: The supplied chart’s 50-period moving average.
Volatility Raises the Stakes
The reported Average True Range (ATR) is 0.0521, or about 1.57% of the quoted price. ATR measures recent price movement rather than predicting direction, but this reading highlights the risk of rapid swings. The source also reports declining volume near the highs, which could suggest weakening participation; that interpretation should be confirmed against the actual volume series.
Conclusion:
Natural gas retains a bullish structure, but the $3.321 area presents elevated reversal risk. A break above $3.350 could extend the rally, while a confirmed move below $3.164 would weaken the trend. With momentum stretched and volatility elevated, traders should wait for confirmation, manage position sizes carefully and avoid relying on overbought readings alone.
Sources & Methodology
Primary-source standard: Market-moving facts should link to original data releases, regulator notices, company filings or official project announcements whenever available. Secondary reporting is used for additional context, not as a substitute for original evidence.
Page last reviewed: