Chainlink (LINK) is drawing renewed market attention after its partnership with South Korean technology company LG CNS to support the country’s expanding digital asset market. The collaboration, announced on October 22, 2026, targets South Korea’s estimated $68 billion digital asset sector, including infrastructure for Korean won-linked stablecoins and other blockchain-based financial applications.
The agreement could strengthen Chainlink’s position in institutional blockchain adoption. Its decentralized oracle network connects smart contracts with external data, while its broader infrastructure supports cross-chain communication and tokenized assets. These capabilities may become increasingly relevant as financial institutions explore regulated digital currencies and blockchain settlement systems.
LG CNS has also been involved in South Korea’s Project Hangang, a central bank digital currency initiative led by the Bank of Korea. Although the partnership expands Chainlink’s potential reach, its long-term effect on LINK’s price will depend on actual adoption, network usage and broader cryptocurrency market conditions.
Derivatives Data Signals Improving Sentiment
LINK was trading near $12.19 in the supplied market data, with traders monitoring whether the token can break above its short-term technical resistance. The price remains below the 50-day exponential moving average, or EMA, near $12.39, leaving a key recovery level in focus.
Derivatives indicators suggest a modest bullish bias. The supplied data puts the long-to-short ratio at approximately 1.16, while the funding rate stands near +0.0057%. Positive funding generally indicates that traders holding long perpetual futures positions are paying short-position holders, although these figures can change quickly and do not guarantee further gains.
Traders can monitor updated positioning and funding data through CoinGlass. However, leveraged positions can unwind rapidly if prices move against the majority of traders, potentially increasing volatility.
LINK Forecast: Key Levels to Watch
From a technical perspective, the $12.39 area is the first important hurdle for LINK. A sustained move above this level could improve the short-term outlook, while a failure to break through may leave the token vulnerable to renewed selling pressure.
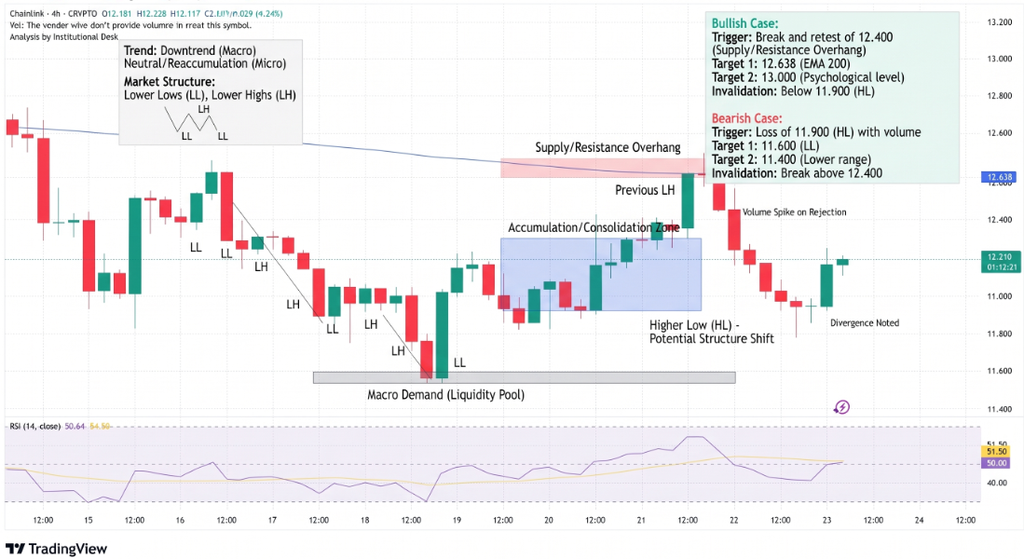
Key levels from the supplied technical analysis include:
- Resistance: $12.39, near the 50-day EMA.
- First support: $11.93, where buyers may attempt to defend the price.
- Additional support: $11.53, near the 100-day EMA.
- Longer-term reference: $10.98, near the 200-day EMA.
- Momentum: RSI near 44 and a negative MACD reading suggest that bullish momentum remains unconfirmed.
The Relative Strength Index (RSI) remains below the neutral 50 threshold, while the Moving Average Convergence Divergence (MACD) points to lingering downside momentum. These signals indicate that LINK may need stronger buying pressure before establishing a sustained recovery.
A break below $11.93 could expose the $11.53 area, followed by the 200-day EMA near $10.98. Conversely, a decisive move above $12.39 would offer an initial sign of improvement, although stronger confirmation would require continued buying and a sustained recovery above subsequent resistance levels.
Conclusion
Chainlink’s partnership with LG CNS strengthens its institutional outlook by connecting its blockchain infrastructure with South Korea’s developing digital asset ecosystem. However, the agreement alone does not guarantee an immediate increase in LINK’s price. Traders should watch $12.39 resistance and $11.93 support for the next directional signal. A sustained break above resistance could support a recovery, while a move below support would increase downside risks. Market sentiment, derivatives positioning and evidence of real-world adoption will remain important factors in the outlook for LINK.
Sources & Methodology
Primary-source standard: Market-moving facts should link to original data releases, regulator notices, company filings or official project announcements whenever available. Secondary reporting is used for additional context, not as a substitute for original evidence.
Page last reviewed: