
The Australian dollar is struggling to extend its advance against the US dollar, with AUD/USD holding above the psychologically important 0.7000 level but facing resistance near 0.7033. The pair recently reached a one-month high before retreating, as traders avoided aggressive positions ahead of Australian inflation data, the Federal Reserve’s policy decision and major US economic releases. The technical picture shows tentative improvement, but a decisive break above the 100-day simple moving average (SMA) is needed to strengthen the bullish case.
Central Banks and Inflation in Focus
The next major catalyst is Australia’s September consumer price index report, scheduled for October 28. The Australian Bureau of Statistics will publish the figures as investors assess whether inflation remains high enough to prompt further tightening by the Reserve Bank of Australia.
The latest available August data showed annual headline inflation at 4.0%, up from 3.5% in July, while trimmed-mean inflation remained at 3.6%. Further evidence of persistent price pressures could reinforce expectations of another RBA rate increase and support the Australian dollar. A softer report, however, could weaken those expectations.
The Federal Reserve is due to announce its decision on October 28 after a two-day meeting. Markets will assess the policy statement and Chair Kevin Warsh’s remarks for clues about the direction of US interest rates. On October 29, the US Bureau of Economic Analysis is scheduled to release its advance third-quarter GDP estimate and September personal income and outlays data, including the PCE inflation measure.
These releases could influence the US dollar through changes in interest-rate expectations. Geopolitical uncertainty and movements in US Treasury yields may also affect demand for the dollar, complicating the outlook for AUD/USD.
AUD/USD Technical Levels to Watch
The pair remains below the 100-day SMA near 0.7033, which is the immediate hurdle for buyers. The supplied four-hour and daily technical readings point to a cautious recovery: the MACD has turned mildly positive, while the RSI at 52.9 sits just above the midpoint of its 0–100 range. Neither indicator independently confirms a sustained breakout.
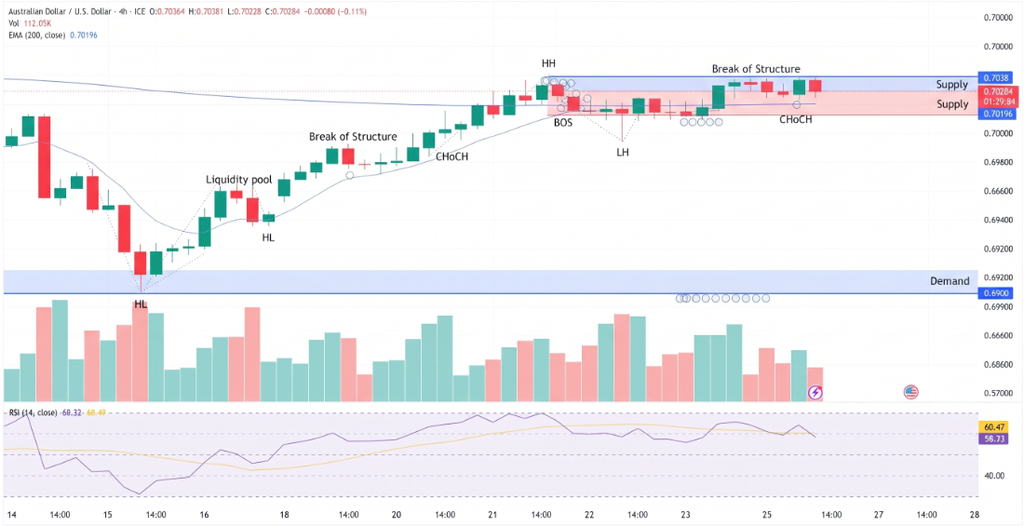
Key levels from the supplied analysis include:
- First resistance: 0.7033, the 100-day SMA.
- Upside targets: 0.7064, 0.7105 and 0.7162.
- Higher recovery barrier: 0.7236.
- Support levels: 0.6974 and the cycle low near 0.6893.
A sustained break above 0.7033 could open the way toward 0.7064, the 50% Fibonacci retracement, and then 0.7105. Failure to clear resistance could leave the pair vulnerable to another pullback.
Conclusion
AUD/USD has some support from expectations of tighter RBA policy, but buyers have yet to overcome the 100-day SMA. Australian inflation and US policy and economic data could determine whether the pair extends its recovery or returns toward lower support. Until price establishes a convincing move above 0.7033, the bullish outlook remains conditional rather than confirmed.
Sources & Methodology
Primary-source standard: Market-moving facts should link to original data releases, regulator notices, company filings or official project announcements whenever available. Secondary reporting is used for additional context, not as a substitute for original evidence.
Page last reviewed: