
The US Dollar Index (DXY) attracted buyers near 101.55–101.60 on Monday, extending its recovery from a recent three-week low as investors prepared for the Federal Reserve’s policy announcement. The index remained below 102.00, reflecting caution ahead of several events that could reshape expectations for US interest rates. A combination of elevated energy prices, geopolitical risks and upcoming inflation data may support the dollar, but the next directional move will depend on whether buyers can overcome nearby technical resistance.
Fed Decision and US Data in Focus
The Federal Reserve will conclude its two-day policy meeting on October 28. Investors are expected to focus on the decision and Chair Kevin Warsh’s press conference for clues about whether interest rates will remain restrictive or whether policymakers see scope for a change later this year.
Expectations for further tightening have been influenced by persistent inflation concerns, including the potential impact of elevated oil prices. Higher energy costs can feed into consumer prices and complicate the Fed’s efforts to bring inflation under control. That prospect may support the dollar if investors anticipate US rates staying higher for longer.
The calendar also includes two important releases on October 29. The Bureau of Economic Analysis is scheduled to publish its advance estimate of third-quarter US gross domestic product (GDP) alongside September personal income and outlays data, which include the Personal Consumption Expenditures (PCE) Price Index.
Stronger economic growth or persistent inflation could reinforce expectations for restrictive policy. Softer readings may have the opposite effect. Meanwhile, Middle East tensions and uncertainty in financial markets could influence safe-haven demand for the dollar, although geopolitical developments can also trigger abrupt changes in sentiment.
DXY Technical Levels Define Next Move
DXY traded around 101.60 in the supplied technical snapshot, with the four-hour chart retaining a modestly bullish bias while the index holds above the 200-period simple moving average and the 38.2% Fibonacci retracement near 101.30.
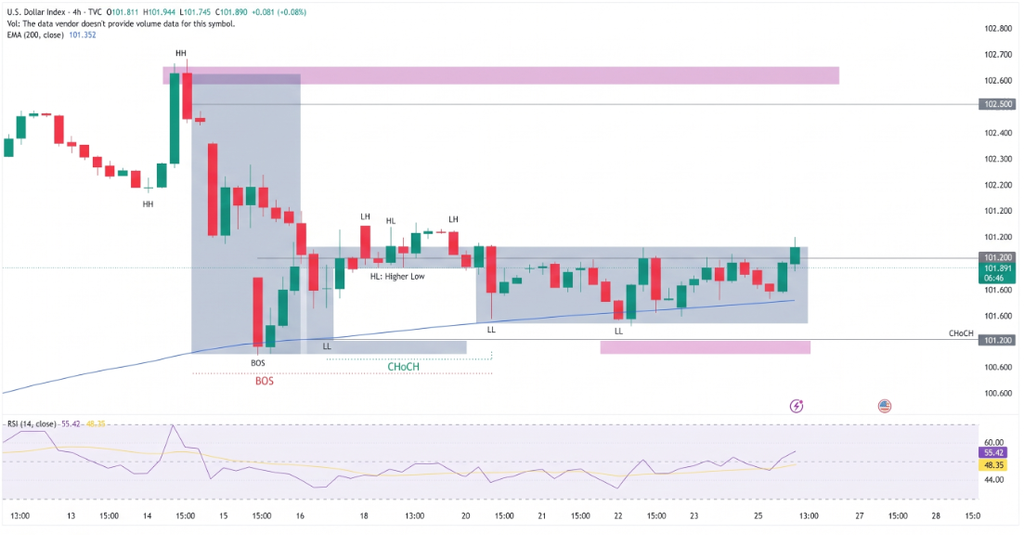
The Moving Average Convergence Divergence (MACD) indicator was slightly positive, while the Relative Strength Index (RSI) hovered near 50. These readings suggest relatively balanced momentum, rather than a decisive bullish trend.
The main technical levels to watch are:
- Immediate support: 101.30, where the 38.2% retracement aligns with the four-hour 200-period SMA.
- Lower support: 100.78 and 100.27.
- Deeper support zones: 99.53 and 98.60.
- Initial resistance: 101.93, near the 23.6% Fibonacci retracement.
- Major resistance: 102.96–103.00, around the recent cycle high.
Holding above 101.30 would preserve the near-term recovery setup. A decisive break below that level could expose 100.78 and 100.27. On the upside, a sustained move above 101.93 would strengthen buying momentum, while a convincing break above 103.00 would provide stronger evidence that the broader advance is resuming.
Conclusion
The US Dollar Index remains supported above 101.50, but the next move depends on monetary-policy guidance and incoming economic data. The 101.30 area is the key support threshold, while 101.93 represents the first meaningful resistance. A break above 103.00 would strengthen the bullish outlook; a loss of 101.30 would shift attention toward lower support. Until either boundary breaks decisively, the dollar’s recovery remains vulnerable to changing rate expectations and market sentiment.
Sources & Methodology
Primary-source standard: Market-moving facts should link to original data releases, regulator notices, company filings or official project announcements whenever available. Secondary reporting is used for additional context, not as a substitute for original evidence.
Page last reviewed: