
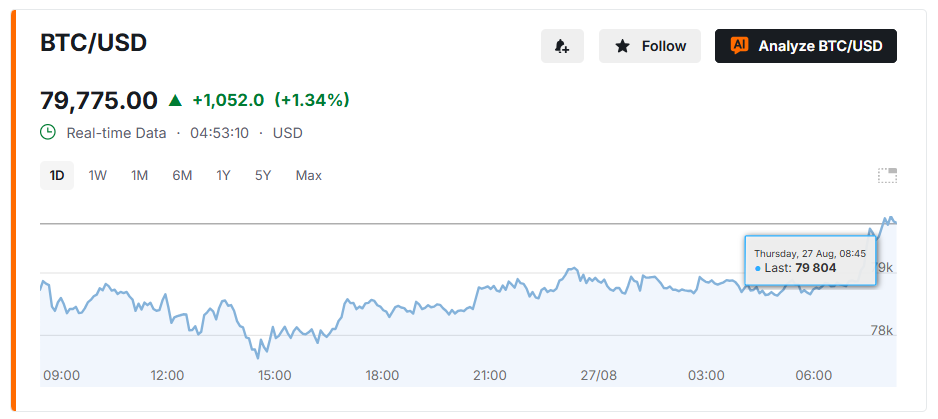
Bitcoin is trading at $78,788 on the five-hour chart, squeezed between strong bullish structure and clear signs of fading momentum. Price sits 18.4% above its 200-period moving average, a stretch consistent with late-stage rally behavior, while the broader uptrend stays confirmed above $76,027. A doji candle at current levels shows indecision after the recent run, and with the coin still roughly 38% below its October 2025 record near $126,272, the setup leaves room for a move in either direction once the current range breaks.
Parabolic Surge Meets Tension
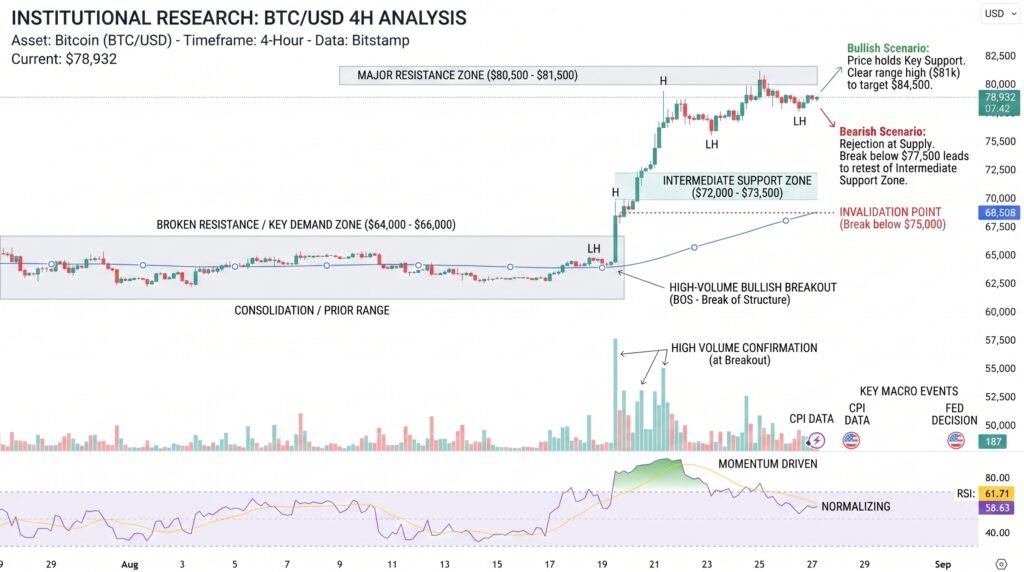
Bitcoin’s structural picture remains bullish: both the SuperTrend indicator and the Ichimoku Cloud confirm an uptrend as long as price holds above $76,027. But the details underneath tell a different story. The MACD has turned bearish, momentum is fading, and the most recent candle closed as a doji — open and close landing almost level, a direct sign of indecision after an extended run higher.
Volume is declining alongside the momentum shift. The RSI at 62.5 is easing back from overbought territory, suggesting buyers may be due for a pause rather than an immediate reversal. Price is currently consolidating in a no-trade zone between $77,500 and $79,500, with breakout direction still unclear.
- Bullish setups target a breakout above the current range, aiming for psychological resistance at $83,500 and higher Fibonacci extensions.
- Bearish setups look for a mean-reversion pullback toward long-term moving averages and key Fibonacci retracement levels.
Bulls vs. Bears in the Chop
Risk management matters most while price sits inside this range. Stops for both directions are typically set at 1.5 times the Average True Range given current volatility, with a move to breakeven once initial targets are hit and re-entry points planned in case a signal fails.
Two levels frame the broader decision. The $76,000 zone marks where long positions still make sense structurally, while a daily close above $81,220 would invalidate the bearish case entirely. A close outside either boundary is likely to determine the next major move, and given how far price already sits above its moving averages, a failure of support could trigger a fast reversion rather than a gradual pullback.
Momentum’s Double-Edged Sword
The bull flag pattern underpinning this rally is roughly 70% complete and remains technically valid, but the indecision candle and weakening MACD argue against chasing a breakout without confirmation. Price is stretched far above its major moving averages — the kind of extension that has historically preceded sharp corrections once momentum fully turns.
For now, staying inside the chop between $77,500 and $79,500 is the more disciplined approach until direction clarifies. A move above $79,200 would favor a push toward new local highs, while a break below $78,000 would signal a meaningful retrace is underway. Given how quickly sentiment can shift after a parabolic run like this one, traders should expect volatility to spike sharply once either level gives way.
Sources & Methodology
Primary-source standard: Market-moving facts should link to original data releases, regulator notices, company filings or official project announcements whenever available. Secondary reporting is used for additional context, not as a substitute for original evidence.
Page last reviewed: