
Brent crude oil faces increasing downside pressure after falling below its short-term moving averages and the Ichimoku cloud. The supplied five-hour technical snapshot places the price at $110.24, below the cloud between $111.70 and $111.73. Although the broader trend retains support from the 200-period Simple Moving Average (SMA) at $104.89, weakening momentum raises the risk of a deeper correction. Traders are now watching $108.17 as a key support level, with a sustained break potentially opening the way toward lower Fibonacci levels.
Brent’s technical structure turns bearish
The move below the Ichimoku cloud signals that short-term market structure has weakened. Brent also trades beneath its 20-period SMA at $111.13, while the Moving Average Convergence Divergence (MACD) shows a bearish configuration, with its reading of 0.18 below the signal line at 0.28.
The Relative Strength Index (RSI) stands at 46.23. Although this reflects weaker buying momentum, it is not yet in conventional oversold territory, which generally begins below 30. The Bollinger Bands place the lower boundary near $108.58, creating a potential area for support if selling continues.
There are still reasons to avoid treating the decline as a confirmed long-term reversal. The supplied 200-period SMA remains at $104.89, below the current price. Average True Range (ATR) is 1.83, equivalent to approximately 1.66% of the quoted price, indicating meaningful short-term price movement.
$108.17 support becomes the key test
The immediate downside focus is the 23.6% Fibonacci retracement at $108.17. This level also aligns with the lower Bollinger Band region near $108.58 and has reportedly attracted support on three previous occasions.
A decisive move below $108.17 would weaken the bullish case and expose the next retracement at $102.42. The 200-period SMA at $104.89 remains an important intermediate reference, although it sits above that deeper Fibonacci level.
The chart also shows a developing double-top formation around $117.45, estimated to be approximately 70% complete. This pattern suggests that buying strength has faded, but it requires confirmation through a break of neckline support rather than serving as a guaranteed price target.
Key levels traders are monitoring include:
- Immediate resistance: $111.15–$111.75.
- Major resistance: $113.50.
- First support: $108.17–$108.58.
- Next Fibonacci support: $102.42.
- Bullish invalidation: $112.00.
- Bearish invalidation: $107.50.
Brent outlook: Sellers retain control
The preferred near-term scenario remains bearish while Brent trades below the $111.15–$111.75 resistance area. A recovery into this zone could encounter selling pressure from the moving averages and lower edge of the Ichimoku cloud. The $109–$111 region, meanwhile, may produce choppy trading without a clear directional signal.
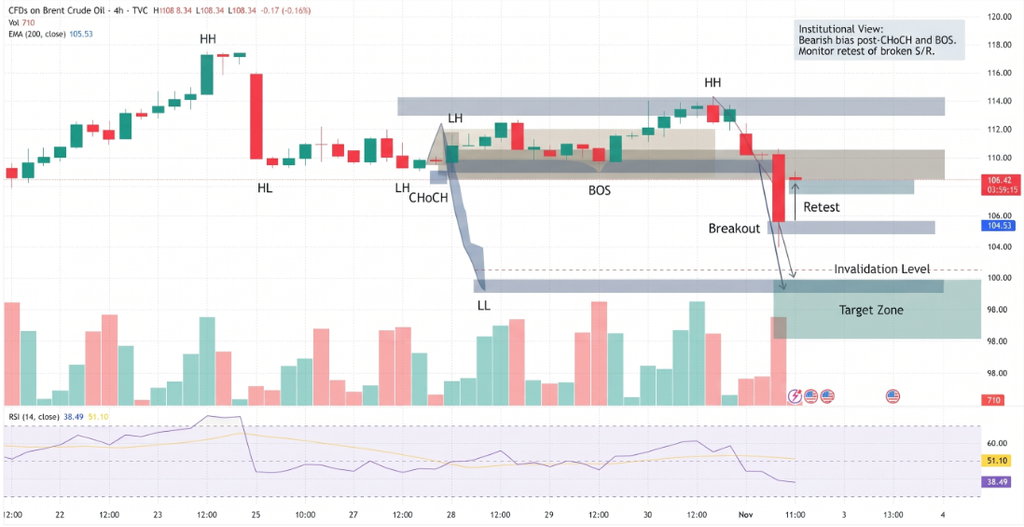
A rejection near $109.43 has provided only limited evidence of buyer support. Decreasing volume also suggests that the market has yet to establish strong buying conviction.
Conclusion
Brent’s short-term outlook remains under pressure following its break below the Ichimoku cloud. A sustained move beneath $108.17 could extend the correction toward the $104.89 moving average and potentially the $102.42 Fibonacci level. However, a recovery above $112.00 would weaken the bearish setup, while a move beyond $113.50 would provide stronger evidence of renewed buying interest. Until those resistance levels are reclaimed, sellers retain the technical advantage.
Sources & Methodology
Primary-source standard: Market-moving facts should link to original data releases, regulator notices, company filings or official project announcements whenever available. Secondary reporting is used for additional context, not as a substitute for original evidence.
Page last reviewed: