
Pi Network’s PI token is struggling to recover, trading near $0.0756 on Monday after two consecutive daily declines. The weakness persists despite a software update designed to improve remote access and security for applications hosted on users’ computers. While the upgrade may make the ecosystem more accessible to developers, it has yet to reverse the token’s technical downturn. Traders are watching support near $0.0704 and resistance around $0.0811 as they assess whether PI can stabilize or extend its decline.
Pi Desktop Upgrade Improves Access
The Pi Core Team announced Desktop version 0.6.4 on October 22, introducing changes to SoloHost, a feature that allows users to run supported applications on their own computers and access them remotely through Pi Browser.
The update removes the need to configure home routers for remote connections, reducing a technical barrier for users who want to access locally hosted applications, including AI tools. It also adds protections intended to limit each application’s access to its own files and network, helping reduce the risk of unauthorized access to other applications or computer resources.
The release follows Pi Mainnet’s upgrade to Protocol 28 on October 16. According to the project, that upgrade addresses transaction-data delays and simplifies smart-contract maintenance for developers.
These changes could improve the network’s usability, but technical progress does not automatically translate into stronger token demand. Price performance also depends on broader cryptocurrency sentiment, available liquidity and buyers’ willingness to hold PI at current valuations.
PI Price Tests Critical Support Levels
PI traded around $0.0756 in the supplied market snapshot, remaining below its descending resistance trendline near $0.0811. The technical setup also places the token beneath its 50-day exponential moving average (EMA) at $0.0844 and its 200-day EMA at $0.1195, indicating that the broader trend remains under pressure.
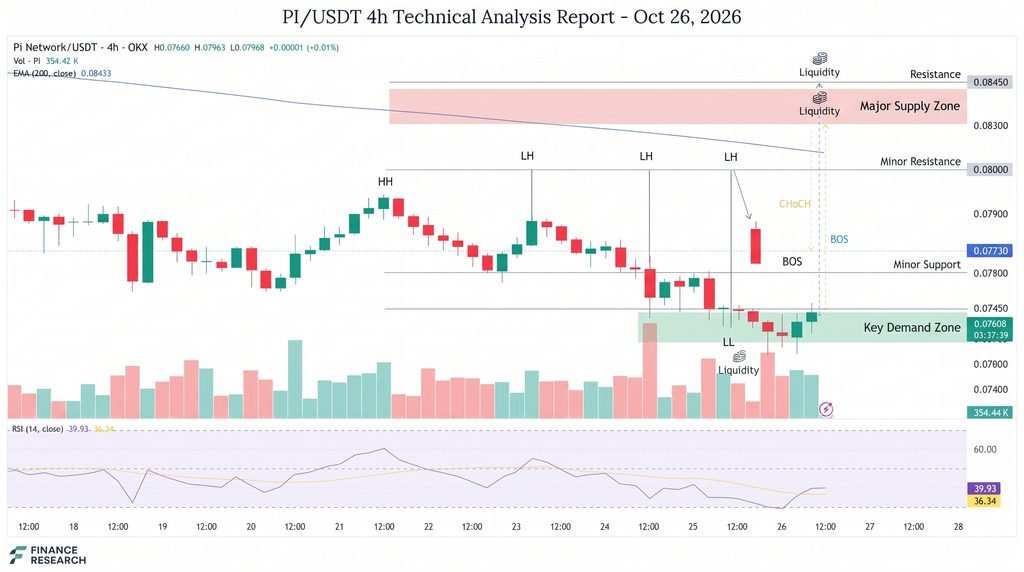
The Relative Strength Index (RSI) was near 33, approaching the commonly used oversold threshold of 30. Meanwhile, the Moving Average Convergence Divergence (MACD) remained slightly below zero. Together, these readings point to weak momentum, although oversold conditions can persist during a sustained decline.
Key levels to monitor include:
- Immediate support: $0.0704, the recent swing low.
- First resistance: $0.0811, near the broken trendline.
- Additional resistance: $0.0844, the 50-day EMA.
- Fibonacci resistance: $0.0867, the 23.6% retracement level.
- Longer-term barrier: $0.1195, the 200-day EMA.
A break below $0.0704 could expose PI to further losses. Conversely, a sustained recovery above $0.0811 would be an initial sign of improving demand, with $0.0844–$0.0867 forming the next resistance zone.
Conclusion
Pi Network’s latest software improvements strengthen remote access and application security, but they have not yet changed PI’s bearish technical outlook. The $0.0704 level is the key downside threshold, while $0.0811 marks the first meaningful recovery hurdle. A move above the 50-day EMA and Fibonacci resistance would provide stronger evidence of a reversal. Until then, the token remains vulnerable to further selling, and traders should distinguish improvements in network functionality from evidence of sustained market demand.
Sources & Methodology
Primary-source standard: Market-moving facts should link to original data releases, regulator notices, company filings or official project announcements whenever available. Secondary reporting is used for additional context, not as a substitute for original evidence.
Page last reviewed: