Silver remains under heavy selling pressure, with prices testing the critical $48.89 support level after an extended decline. The supplied technical snapshot places silver near $50.38, with momentum indicators pointing to a firmly established bearish trend. Although the Relative Strength Index (RSI) and Money Flow Index (MFI) suggest that selling may be approaching exhaustion, neither confirms a reversal. Traders are watching whether buyers can defend $48.89 or whether another breakdown will expose lower price targets.
Silver’s downtrend remains firmly established
The technical structure continues to favor sellers. The Average Directional Index (ADX) stands at 49.15, indicating exceptionally strong trend momentum. Because ADX measures trend strength rather than direction, its elevated reading supports the assessment of a powerful move when considered alongside silver’s declining price structure.
The RSI is at 31.74, close to the conventional oversold threshold of 30. Meanwhile, the Money Flow Index has fallen to 12.35, reflecting intense selling pressure. These readings leave room for a relief rally, but they do not establish that the decline has ended.
Silver is also trading near the lower Bollinger Band at $49.02. This may attract short-term buying, although a sustained move below the band could indicate continued downside momentum. The SuperTrend indicator remains bearish at $51.81, while the Ichimoku cloud between $51.40 and $53.82 places broader technical resistance above the market.
The active descending channel reinforces the negative structure. Average True Range (ATR) is 0.86, or approximately 1.7% of the quoted price, highlighting the potential for substantial intraday fluctuations.
$48.89 support becomes the critical test
The $48.89 level represents the recent low and an important near-term support zone. A hammer candlestick formed around this price on October 30, suggesting buyers attempted to defend the level. However, one candlestick pattern is not sufficient confirmation of a durable reversal.
A sustained five-hour close below $48.89 could strengthen the bearish case and expose $47.00, followed by $45.00. The next major resistance area sits between $51.80 and $52.40, where the SuperTrend and short-term moving averages may limit recovery attempts.
Key levels to monitor include:
- Immediate support: $48.89.
- Lower targets: $47.00 and $45.00.
- Initial resistance: $51.80–$51.82.
- Major recovery hurdle: $52.40.
- Fibonacci resistance: $54.15 and $57.40.
Silver forecast: Rebound or breakdown?
The bearish scenario remains favored while silver trades below $51.82. A recovery toward $51.80–$52.40 could attract selling if the price fails to reclaim resistance. A confirmed break below $48.89 would provide stronger evidence that the descending trend is continuing.
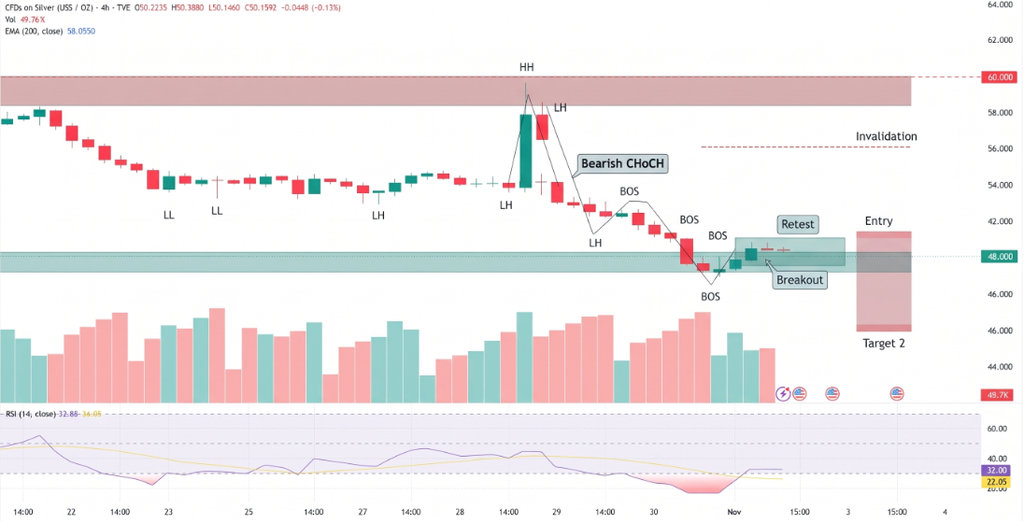
The bullish alternative requires buyers to defend the recent low and push silver back above $51.82. A sustained recovery could then expose $54.15, the 23.6% Fibonacci retracement of the decline from $71.16 to $48.89. A stronger advance could bring $57.40 into focus, corresponding to the 38.2% retracement.
Conclusion
Silver’s technical outlook remains bearish despite increasingly oversold momentum readings. The $48.89 support level is the immediate dividing line between a potential relief rebound and another leg lower. A confirmed breakdown could expose $47.00 and $45.00, while a recovery above $51.82 would provide the first meaningful sign that selling pressure is easing. Until buyers reclaim that resistance, rebounds remain vulnerable to renewed selling.
Sources & Methodology
Primary-source standard: Market-moving facts should link to original data releases, regulator notices, company filings or official project announcements whenever available. Secondary reporting is used for additional context, not as a substitute for original evidence.
Page last reviewed: