
Solana extended its decline on Monday, trading near $95.48 after recording five consecutive weeks of losses. Investor withdrawals from US-listed spot Solana exchange-traded funds (ETFs) have added to the pressure, with weekly outflows reaching a record $71.47 million since the funds launched. Meanwhile, weakening on-chain metrics and a bearish technical structure suggest sellers remain in control. Traders are now watching whether SOL can defend support near $88.42 or faces a deeper retreat toward $78.35.
SOL ETFs record $71.47M in outflows
Institutional demand for Solana appears to be weakening. Data from SoSoValue shows that US-listed spot SOL ETFs recorded $71.47 million in net withdrawals during the week ending October 30. That was the largest weekly outflow since the products began trading.
The withdrawals also extended a negative trend that began in early October, marking four consecutive weeks of net outflows. Persistent redemptions suggest some investors are reducing their exposure to SOL through regulated investment products.
ETF flows are not a direct measure of every institutional investor’s activity, but they provide a useful indication of demand for exchange-traded exposure to an asset. Continued withdrawals could therefore weigh on sentiment, particularly while SOL remains below important technical levels.
On-chain signals reinforce bearish sentiment
Market indicators tracked by CryptoQuant point to additional caution. Its Solana market summary highlights large whale orders and selling dominance across spot and futures markets. Spot-market activity also shows signs of overheating.
These signals suggest that selling pressure remains significant despite SOL’s already extended decline. Large orders do not necessarily indicate that every major holder is distributing tokens, but their presence alongside broader sell-side dominance adds to the cautious outlook.
For traders, several indicators deserve attention:
- Whale activity: Large orders are appearing across spot and derivatives markets.
- Selling pressure: Market activity remains tilted toward sellers.
- Spot conditions: Overheating signals suggest the market may remain vulnerable to volatility.
Solana price forecast: Key levels to watch
SOL trades near $95.48, below its 50-day, 100-day and 200-day exponential moving averages (EMAs), positioned at $103.81, $99.96 and $98.08, respectively. This alignment reinforces the bearish near-term structure.
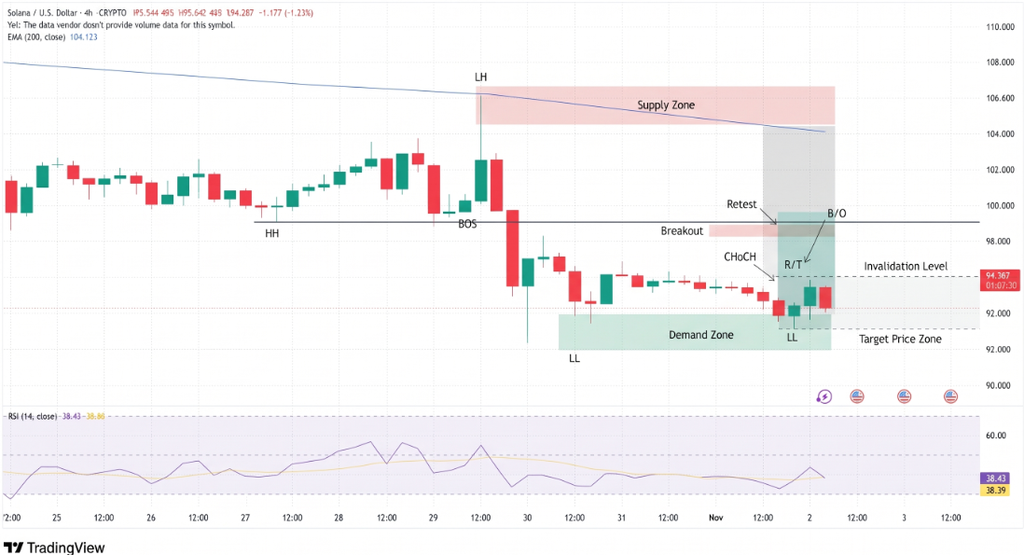
The token has also fallen below horizontal resistance at $97.76. The Relative Strength Index (RSI) near 31 indicates that SOL is approaching oversold territory, although this alone does not confirm a reversal. Meanwhile, the Moving Average Convergence Divergence (MACD) remains negative, with recovery momentum still subdued.
A sustained move above $97.76 could bring the 200-day EMA at $98.08 and the 100-day EMA at $99.96 into focus. The 50-day EMA at $103.81 represents a stronger resistance level, followed by $122.76.
On the downside, support around $88.42 is the first important level. A decisive break could expose the stronger floor near $78.35.
Conclusion
Solana faces a challenging recovery as record weekly ETF withdrawals, persistent selling pressure and bearish technical indicators weigh on investor sentiment. The $88.42 support level is crucial in the near term; a break below it could open the way toward $78.35. Conversely, reclaiming $97.76 and moving above the $98–$100 resistance zone would offer an early indication that buyers are regaining control. Until SOL achieves that recovery, the broader outlook remains bearish, with ETF flows and trading activity likely to influence its next move.
Sources & Methodology
Primary-source standard: Market-moving facts should link to original data releases, regulator notices, company filings or official project announcements whenever available. Secondary reporting is used for additional context, not as a substitute for original evidence.
Page last reviewed: