
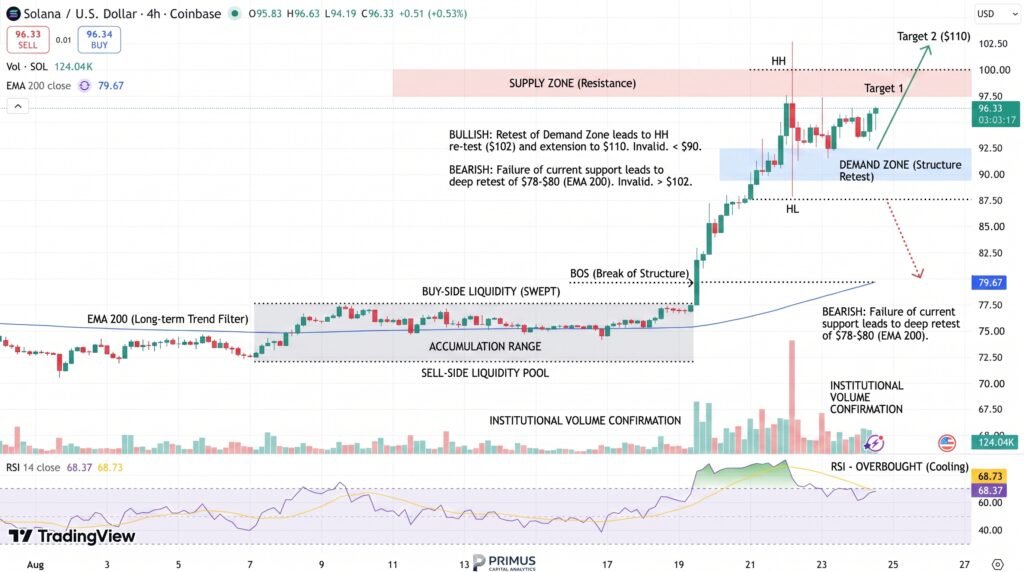
Solana is trading near $94-$95 after rebounding sharply from the mid-$70s, giving its weekly chart its strongest momentum in months. SOL climbed from roughly $74.60 on August 17 to above $100 intraday on August 22 before pulling back, according to market data. The rebound has improved short-term structure, but it has not yet confirmed a full trend reversal. The next major test sits around $100-$110, while Solana remains roughly 68% below its January 2025 all-time high of $294.33.
Weekly Signal Improves SOL Structure
Technical analyst Jesse Olson has highlighted a fresh weekly buy signal on Solana after the token recovered from its recent base. The move is significant because SOL entered August trading well below $100 and spent several sessions around the $74-$80 region. Investing.com data show SOL at approximately $74.61 on August 17, before rising to $85.37 on August 19 and $93.72 on August 21. It then reached an intraday high above $102 on August 22.
That sequence confirms a rapid improvement in momentum. Olson’s chart places particular importance on a weekly buy signal near the recent bottoming area. He has compared the setup with an earlier signal that, according to his analysis, was followed by an initial 35% decline and a later 991% recovery.
That comparison should be treated as analyst context, not a forecast. Historical technical signals do not guarantee the same percentage outcome in a different market cycle. More important than the signal itself is whether price can now establish a higher high and maintain the breakout.
$100-$110 Becomes Confirmation Zone
The clearest resistance sits around $100-$110. SOL already demonstrated how difficult this area may be when price briefly reached $102.49 on August 22 before retreating. That rejection suggests sellers remain active once the token moves above $100.
Recent market data put the most important levels at:
- $100-$105: Immediate resistance and recent rejection zone.
- $108-$110: Stronger weekly confirmation area.
- $75-$80: Main recovery support.
- $65-$70: Deeper support if the rebound fails.
A sustained weekly close above roughly $108-$110 would provide substantially stronger evidence that Solana is moving beyond a relief rally. That would also help establish the first meaningful higher-high structure after the broader decline from above $200.
Failure to reclaim this region would leave SOL vulnerable to further consolidation around current levels or another test of the $75-$80 base. The downside level matters just as much. A weekly break below approximately $76.80 would materially weaken the argument that Solana has established a durable macro bottom.
New Highs Remain a Long-Term Test
Solana’s all-time high remains a much more distant target. CoinMarketCap places SOL’s record at approximately $294.33 on January 19, 2025. With SOL around $94-$95, the token remains approximately 68% below that peak.
From $95, reaching $294.33 would require a gain of roughly 210%. That makes discussion of $500 targets even more speculative. A move from $95 to $500 would require an increase of more than 426%.
Such levels are mathematically possible in cryptocurrency markets but should not be confused with technically confirmed targets. The more immediate evidence is constructive. SOL has recovered above several previously important technical areas, and recent analysis has identified the $95-$98 region as an important resistance band following the break above shorter-term moving averages. For the bullish case to strengthen materially, SOL needs to convert the $100-$110 area from resistance into support.
Conclusion
Solana’s weekly chart has improved sharply, but the recovery remains incomplete. The move from the mid-$70s to roughly $95, combined with a fresh weekly buy signal, suggests selling pressure has weakened. However, the recent rejection above $102 shows that resistance remains significant. A sustained weekly move through $100-$110 would provide stronger evidence of a broader trend reversal, while a return below $75-$80 would undermine the macro-bottom thesis. Solana’s $294.33 all-time high remains far away, so the immediate question is not whether SOL can reach $300 or $500, but whether buyers can first establish control above the $100-$110 zone.
Sources & Methodology
Primary-source standard: Market-moving facts should link to original data releases, regulator notices, company filings or official project announcements whenever available. Secondary reporting is used for additional context, not as a substitute for original evidence.
Page last reviewed: