
The US Dollar Index (DXY) traded near 102.00 on Tuesday, extending its recovery as investors positioned for the Federal Reserve’s October 28 policy decision. The index reached a nearly two-week high before momentum slowed, with traders reluctant to make aggressive bets ahead of the announcement. Attention is shifting to the Fed’s policy statement, Chair Kevin Warsh’s press conference and key US economic releases due later this week. These events could influence interest-rate expectations and determine the dollar’s next directional move.
Fed Decision Drives Dollar Outlook
The Federal Open Market Committee (FOMC) concludes its two-day meeting on Wednesday, October 28. Markets broadly expect the Fed to leave its benchmark interest rate unchanged, making the accompanying statement and Warsh’s comments particularly important for the dollar’s outlook.
Investors will look for clues about whether persistent inflation could prompt another rate increase in December. Higher borrowing costs can support the dollar by improving the relative return on US assets, although the currency’s response will depend on how the Fed’s message compares with market expectations. Traders can follow changing expectations through the CME FedWatch tool.
Energy prices remain a key risk. Elevated crude oil prices can increase transport and production costs, complicating the Fed’s efforts to return inflation to its 2% target. If policymakers emphasize inflation risks, expectations for tighter monetary policy could strengthen the Greenback. A more cautious message, however, could limit further gains.
The next major tests arrive Thursday, October 29, when the United States releases its advance third-quarter gross domestic product (GDP) estimate and September Personal Consumption Expenditures (PCE) price index. The PCE measure is closely watched because it tracks changes in consumer prices and informs the Fed’s inflation assessment. Stronger-than-expected growth or persistent inflation could reinforce expectations that interest rates will stay elevated for longer.
DXY Technical Levels to Watch
On the four-hour chart, the DXY retains a constructive short-term bias while trading above its 200-period Simple Moving Average (SMA). The index has also reclaimed the 23.6% Fibonacci retracement at 101.92, indicating that buyers have regained some control.
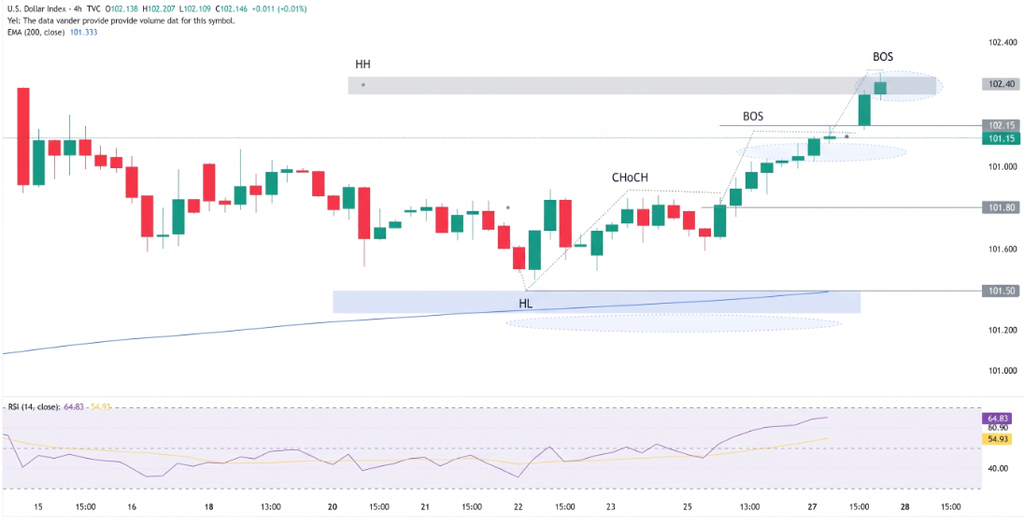
The technical picture remains positive, but resistance near 102.95 could restrict the advance. Traders may monitor these levels:
- Immediate support: 101.92, the 23.6% Fibonacci retracement.
- Stronger support: 101.28–101.26, combining the 38.2% retracement and 200-period SMA.
- First major resistance: 102.95, the cycle anchor level.
- Lower supports: 100.77 and 100.26 if selling pressure intensifies.
- Deeper downside levels: 99.52 and 98.59 if the bullish structure fails.
A sustained move above 102.95 would strengthen the bullish outlook, while a break below 101.92 could expose the moving-average support zone. A deeper decline would bring the 50% retracement at 100.77 into focus, followed by the 61.8% level at 100.26.
Conclusion
The DXY remains supported near 102.00, but a decisive breakout may depend on the Fed’s policy guidance and Thursday’s economic data. A firm inflation message or stronger-than-expected GDP could support the dollar, while softer figures or a less hawkish Fed could trigger a pullback. Technically, 101.92 is the first level to watch on the downside, with 102.95 marking the key resistance barrier. Traders should also monitor US Treasury yields and changes in rate expectations as fresh information arrives.
Sources & Methodology
Primary-source standard: Market-moving facts should link to original data releases, regulator notices, company filings or official project announcements whenever available. Secondary reporting is used for additional context, not as a substitute for original evidence.
Page last reviewed: