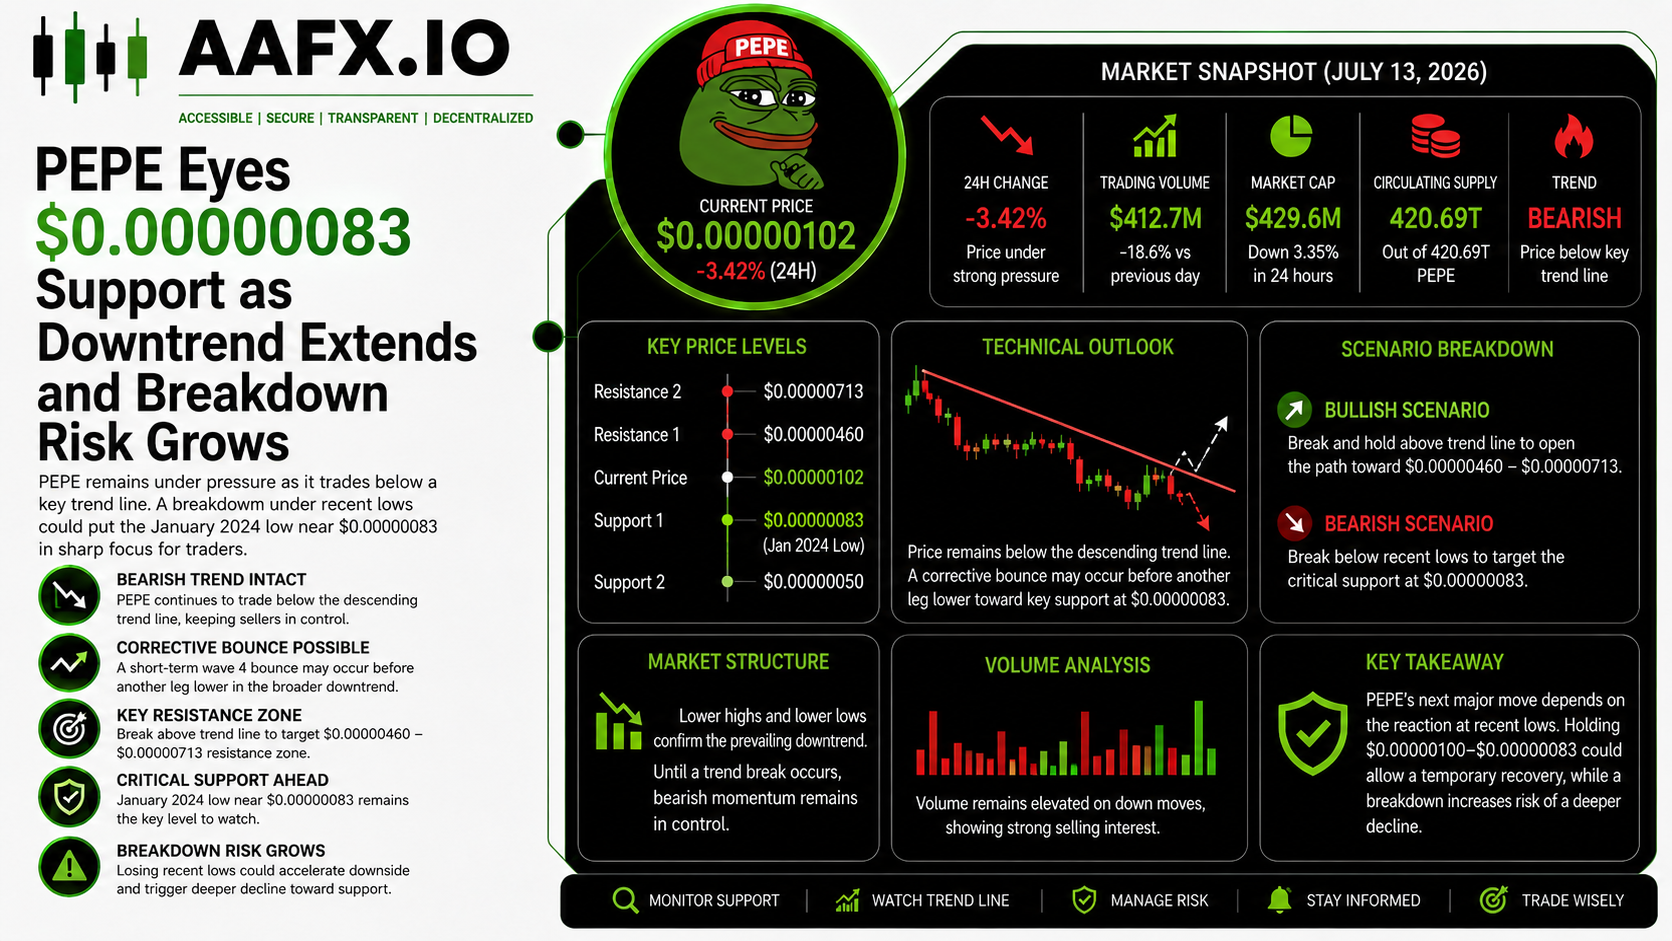
PEPE remains under pressure as traders monitor the critical $0.00000083 support. Explore key resistance levels, trend analysis, and downside risks.
PEPE Trend Weakness Keeps Traders Focused on $0.00000083 Support
PEPE continues to face selling pressure as its price remains trapped beneath a major descending trend line, signaling that bears still hold the upper hand. While some market participants are looking for signs of stabilization, technical indicators suggest that the meme coin has yet to confirm the end of its latest decline.
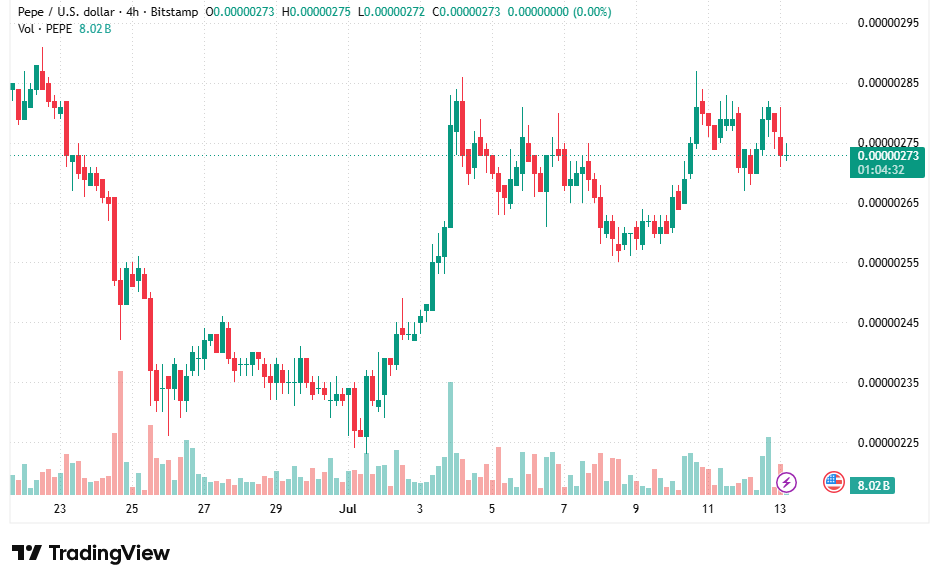
The current chart structure points to a market that remains vulnerable to further downside. Although a short-term rebound is still possible, analysts argue that the broader trend favors caution until PEPE can reclaim key resistance levels. For investors and traders, the coming sessions may prove crucial in determining whether the token can recover or if another wave of losses is ahead.
Trend Line Signals Ongoing Pressure
Technical analysis shared by market observers indicates that PEPE remains in a well-defined short-term downtrend. The token continues to trade below a descending trend line that has acted as resistance throughout the recent decline.
Trend lines are widely used to identify market direction. When prices consistently remain below a falling trend line, it generally reflects stronger selling activity than buying demand. In PEPE’s case, the inability to break above this resistance suggests that bearish momentum remains intact.
Several factors continue to support the cautious outlook:
- Price remains below the primary downward trend line.
- No confirmed reversal pattern has emerged.
- Selling pressure continues to dominate recent trading sessions.
- Key support levels are being tested repeatedly.
Until buyers generate enough momentum to push the token above resistance, traders are likely to remain defensive.
Bounce Scenario Still Possible
Despite the prevailing weakness, analysts have not ruled out the possibility of a temporary recovery. The current structure allows for what technical traders describe as a corrective bounce—a short-lived upward move that occurs within a larger downtrend.
Such rebounds are common during bearish market cycles and can create the appearance of renewed strength before prices resume their decline. For PEPE, a recovery attempt would need to overcome the current trend-line resistance before any meaningful shift in sentiment can occur.
A successful breakout could open the door toward the next resistance region, which is estimated between $0.00000460 and $0.00000713. Reaching that zone would require significantly stronger buying activity and a clear improvement in market confidence.
Why $0.00000083 Matters
The most important level on traders’ radar remains the January 2024 low near $0.00000083. This support area represents a critical technical threshold that could determine PEPE’s next major move.
If recent lows fail to hold, market attention is likely to shift directly toward this support zone. A breakdown below that level could reinforce the bearish trend and potentially trigger additional selling pressure.
Key levels to watch include:
- Support: $0.00000083 (January 2024 low)
- Resistance: Descending trend line
- Higher resistance zone: $0.00000460 to $0.00000713
For now, PEPE’s outlook remains dependent on how price behaves around recent lows. Holding support could encourage a short-term recovery attempt, while a break lower would strengthen expectations for a deeper decline toward the $0.00000083 level.
Sources & Methodology
Primary-source standard: Market-moving facts should link to original data releases, regulator notices, company filings or official project announcements whenever available. Secondary reporting is used for additional context, not as a substitute for original evidence.
Page last reviewed: