Stellar traded near $0.161 on Tuesday, down roughly 3.8% over 24 hours and extending losses below key short- and medium-term moving averages. The decline places XLM below a critical support zone just as derivatives data show traders increasingly positioned for further downside. With long-to-short ratios falling and funding rates turning negative, the setup points toward a possible test of $0.142 before buyers find firmer footing.
Derivatives Data Signal Growing Bearish Bets
XLM’s long-to-short ratio fell to 0.90 on Tuesday, approaching its lowest reading in more than a month, according to Coinglass data. A ratio below 1.0 means short positions now outnumber long positions among active traders, a signal that more market participants are betting on further declines than on a rebound. The funding rate for XLM perpetual futures has also turned negative, meaning short-position holders are effectively being paid by long-position holders to maintain their bets, a dynamic that typically reflects strong demand for downside exposure. Combined with rising open interest, these readings suggest fresh capital is entering the market specifically to bet against a near-term recovery, rather than existing positions simply being closed out.
The broader altcoin backdrop has compounded the pressure. XRP has drifted toward the psychologically significant $1.00 level in the same session, and the pullback across payment-focused tokens appears to reflect a wider risk-off rotation away from altcoins rather than any Stellar-specific catalyst.
Technical Levels Point to $0.142 Support
XLM remains below the descending trendline breakout level at $0.166, which now functions as immediate resistance. The Relative Strength Index sits near 35, indicating weak buying momentum without yet reaching technically oversold territory below 30. The Moving Average Convergence Divergence indicator remains below its zero line, reinforcing the downside bias as price consolidates beneath its key moving averages.
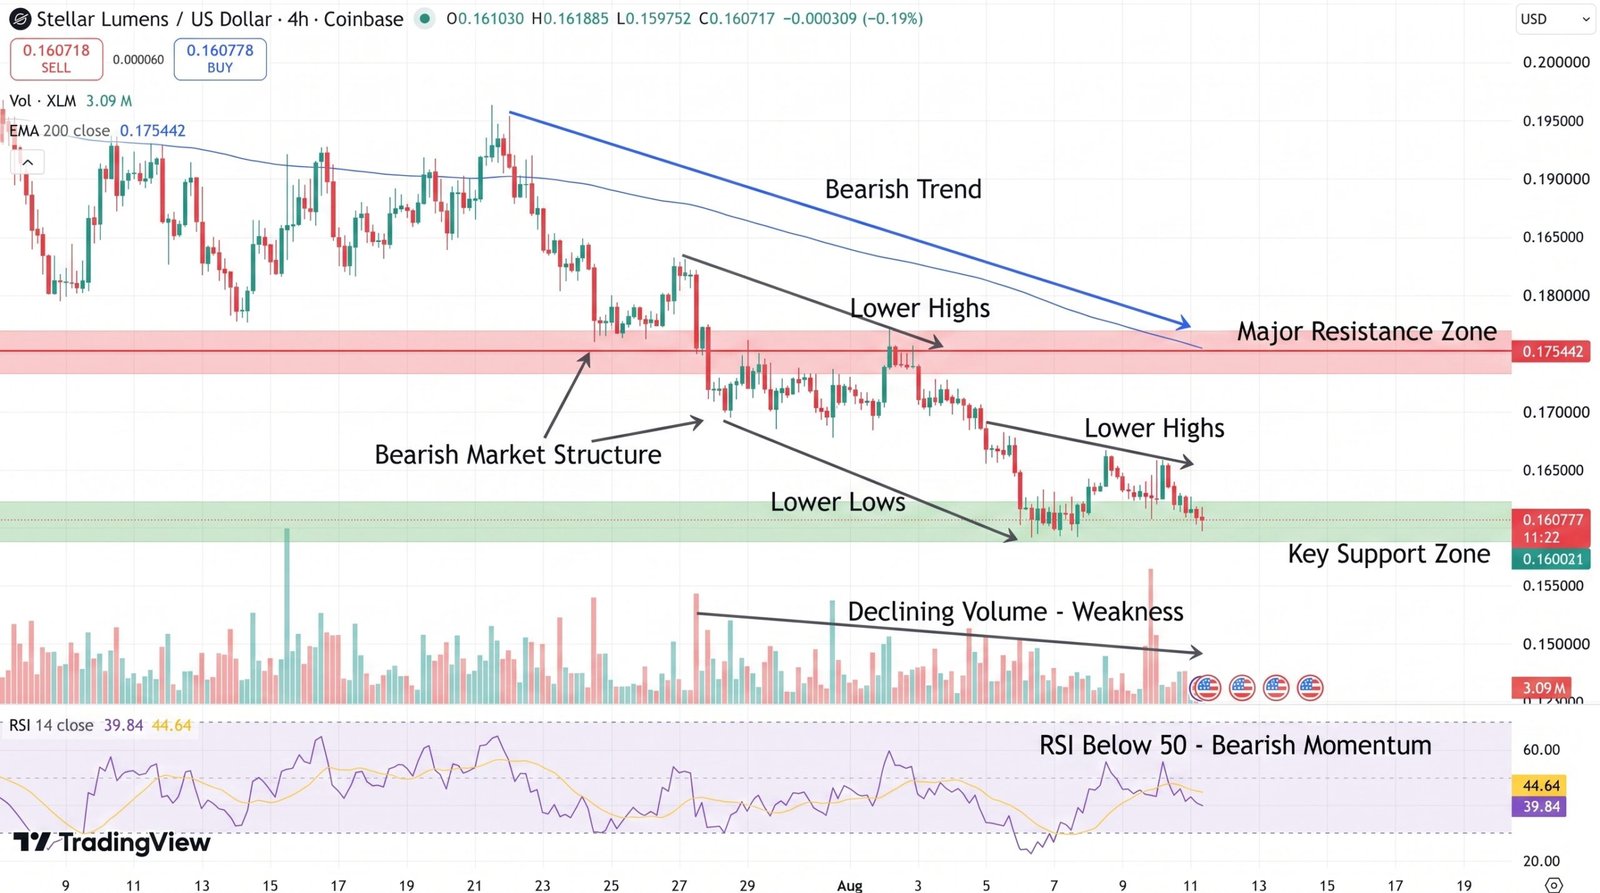
For a recovery to develop, XLM would first need to reclaim the $0.166 trendline. A sustained move above that level would open a challenge toward horizontal resistance at $0.177. Beyond that, the 50-day exponential moving average at $0.178 and the 100-day EMA at $0.181 form a concentrated resistance band that has historically capped upside attempts. The 200-day EMA at $0.193 represents the broader bearish pivot; reclaiming it would be necessary to signal any meaningful shift in the longer-term trend structure.
- Immediate resistance: $0.166 (descending trendline), then $0.177 (horizontal resistance)
- Key downside level: $0.142, a break below which could accelerate losses toward a new price floor
Conclusion
Stellar’s setup reflects a market where derivatives positioning and price structure are pointing in the same direction, a combination that tends to reinforce rather than contradict near-term trend continuation. The 0.90 long-to-short ratio and negative funding rate indicate traders are actively positioning for more downside, not simply reacting to it. Unless XLM reclaims the $0.166 trendline with meaningful volume, the path of least resistance points toward $0.142, and a decisive break below that level would leave the token searching for a new support floor with little technical structure to slow the decline.
Sources & Methodology
Primary-source standard: Market-moving facts should link to original data releases, regulator notices, company filings or official project announcements whenever available. Secondary reporting is used for additional context, not as a substitute for original evidence.
Page last reviewed: