
Ethereum is holding near $2,480 after gaining more than 30% last week, but derivatives data suggest the force behind the initial breakout is beginning to change. The rally was amplified by a major short squeeze that forced bearish traders out of leveraged positions. Now, with open interest lower and leverage reduced, ETH is relying more heavily on spot-market demand to maintain its recovery. Exchange reserves have also declined, providing evidence that investors are not rushing to return ETH to trading platforms despite substantial unrealized gains.
Short Squeeze Gives Way to Spot Demand
Ethereum’s derivatives market remains tilted toward buyers, but the latest data do not show the same aggressive expansion in leverage that typically accompanies a futures-driven rally.
The 30-day moving average of Net Taker Volume turned positive last week, indicating that market-buy orders in perpetual futures have started exceeding market-sell orders. Net Taker Volume measures the difference between aggressive buying and selling executed through market orders, making it useful for assessing which side is taking the initiative in derivatives markets.
The important qualification is open interest.
Ethereum open interest declined by roughly 500,000 ETH over the past week, even as the price climbed. That combination indicates that a meaningful portion of the advance came from existing bearish positions being closed rather than large amounts of new leveraged capital entering long positions.
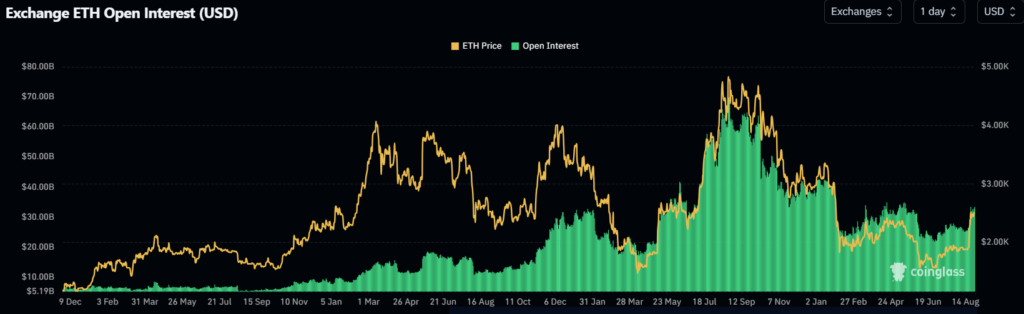
ETH recorded exceptionally heavy short liquidations during the breakout. When prices rise quickly, leveraged short traders can be forced to buy ETH or close bearish contracts to prevent further losses. Those liquidations can accelerate an advance even without equivalent new spot demand.
The process also reduced leverage across the market. Ethereum’s Estimated Leverage Ratio fell toward 0.74, its lowest level since early March. Lower leverage after a rapid rally can reduce immediate liquidation risk, but it also means fresh derivatives demand has yet to confirm the price advance.
Exchange Reserves Fall by 101K ETH
Spot-market behavior presents a more constructive picture.
Approximately 101,000 ETH left exchange reserves over the past week, even as Ethereum moved above the estimated $2,300 average on-chain cost basis cited in market analysis.
That matters because rising prices normally increase the number of profitable holders who could sell. When coins instead leave centralized exchanges, the immediately available supply for trading can decline.
Exchange outflows do not guarantee that investors are holding for the long term. Assets can move for custody, staking, decentralized finance or other reasons. Still, falling reserves during a strong price advance provide a different signal from rising exchange balances, which can indicate increasing potential selling supply.
Ethereum’s broader recovery has also coincided with renewed institutional demand through U.S. spot Ethereum ETFs, which recently returned to consecutive positive-flow sessions.
The combination leaves ETH in an unusual position: derivatives leverage has contracted while spot demand has remained comparatively resilient. That can produce a healthier market structure than a rally driven exclusively by leveraged futures positions, although it does not eliminate the risk of profit-taking after a 30% weekly move.
ETH Holds Above $2,431 Support
Ethereum’s daily chart remains technically bullish, but momentum is stretched.
At approximately $2,480, ETH is trading comfortably above its major short- and medium-term exponential moving averages. The 20-day EMA sits near $2,221, while the 50-day and 100-day averages are around $2,042 and $2,003, respectively. The 200-day EMA, near $2,204, has also been reclaimed.
That alignment shows how quickly Ethereum’s technical structure has improved. Price is now above all four averages, with the shorter averages beginning to reflect the recent acceleration.
The problem is momentum.
The 14-day Relative Strength Index is around 75, above the conventional 70 overbought threshold. The Stochastic Oscillator is above 90, reinforcing the view that ETH has risen rapidly enough to make a period of consolidation increasingly plausible.
The first level that matters on a pullback is $2,431. Holding above it would leave the latest breakout structure largely intact. Below that, the 20-day EMA around $2,221 and horizontal support near $2,172 form a more important defensive area.
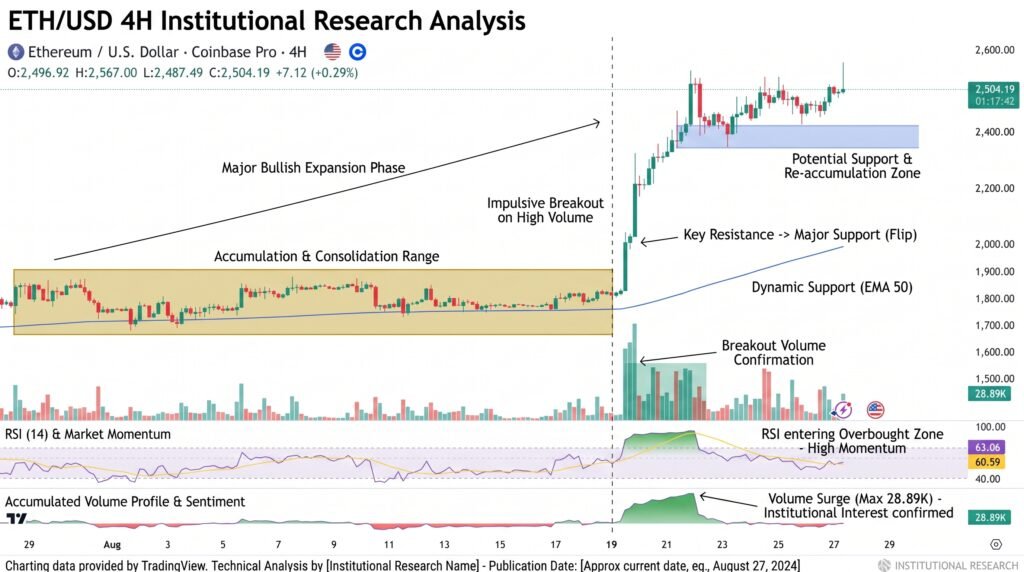
If selling becomes deeper, the $2,042-$2,003 region contains the 50-day and 100-day averages. Losing that cluster would represent a much more significant deterioration in the recovery.
On the upside, approximately $2,736 is the first major resistance area. Beyond it, $2,885 becomes relevant before the psychologically important $3,000 region. A move from $2,480 to $3,000 would require another gain of roughly 21%.
Conclusion
Ethereum’s move to around $2,480 remains technically constructive, but the composition of the rally deserves attention. Falling open interest and a lower leverage ratio show that last week’s surge was heavily influenced by short covering rather than an immediate influx of new leveraged longs. At the same time, the withdrawal of roughly 101,000 ETH from exchanges suggests spot demand has helped absorb profit-taking. The immediate test is $2,431: holding above it would preserve the breakout, while a deeper correction would bring the $2,221-$2,172 region into focus. With RSI near 75, ETH remains bullish but increasingly vulnerable to consolidation after its rapid advance.
Sources & Methodology
Primary-source standard: Market-moving facts should link to original data releases, regulator notices, company filings or official project announcements whenever available. Secondary reporting is used for additional context, not as a substitute for original evidence.
Page last reviewed: