
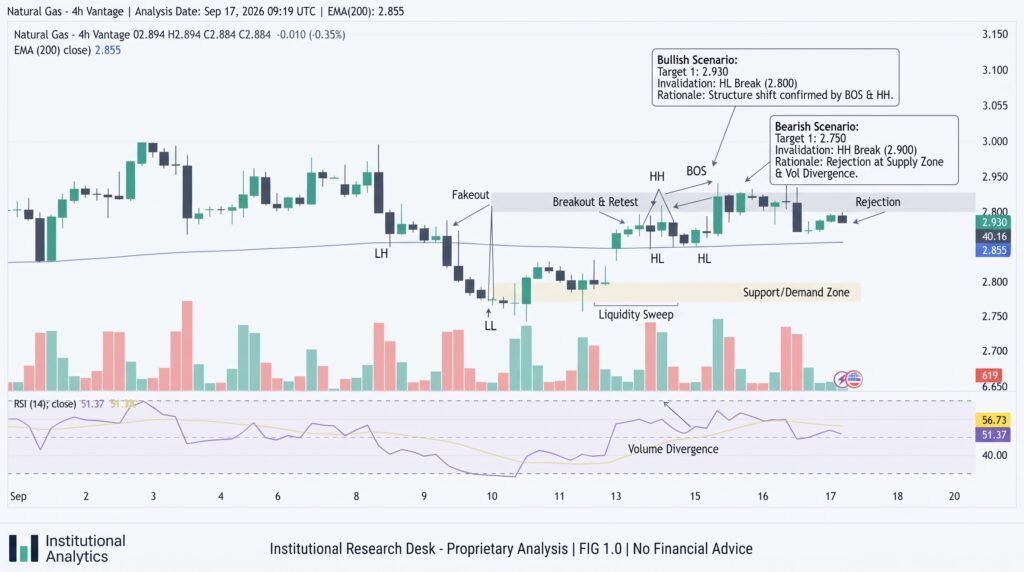
Natural gas is holding near $2.90 as the supplied 5-hour chart shows price compressed between major support and resistance. The latest Investing.com data put the futures contract around $2.90 on September 17, after trading between $2.887 and $2.912 in the session. The narrow range comes as traders monitor technical signals, U.S. storage data and changing supply-demand expectations for the U.S. gas market.
Natural Gas Remains Range-Bound
The chart setup shows a broad $2.80-$3.00 trading range, with repeated reactions around both boundaries. Price near $2.901 is also sitting close to the $2.906 Doji cited in the chart, a formation that reflects limited separation between buyers and sellers.
The long-term structure remains supported by the 200-period SMA near $2.817. The supplied chart also places the Ichimoku Cloud near $2.889, leaving the market just above an important trend reference.
At the same time, sellers continue to defend the $2.95 area. The market has also produced lower highs from the $3.026 peak, while the ADX reading of 18.68 points to limited trend strength.
- Current price: Around $2.90
- Major range support: $2.80
- Key resistance: $2.95-$3.00
- 200-period SMA: $2.817
- Recent swing high: $3.026
Momentum Signals Stay Mixed
The momentum picture remains divided. The supplied chart shows the MACD above its signal line, suggesting that short-term downside pressure has eased. However, the broader price structure has yet to confirm a sustained bullish reversal.
The low ADX reading is equally important. An ADX below 20 generally reflects a market with weak directional momentum, making moves inside the range more vulnerable to reversals rather than confirming a durable trend. That helps explain the repeated failures around $2.95 and the persistence of the $2.80-$3.00 range.
The Fibonacci levels cited in the setup reinforce the importance of the lower trading zone. The 50% retracement sits near $2.821, while the 38.2% level is around $2.869 and the 61.8% level near $2.773.
The next confirmed move will require a clear break from the compressed structure. A sustained move above $2.95 would place $3.00 and then the $3.026 swing high in focus. A decline below $2.89 would weaken the immediate structure, while a break of $2.80 would be more significant for the wider range.
Storage Data Adds Fundamental Risk
The U.S. natural-gas market is also approaching another important data point. The Energy Information Administration publishes its Weekly Natural Gas Storage Report each Thursday at 10:30 a.m. Eastern time. The latest available report, released September 10, showed Lower 48 working gas inventories at 3,254 billion cubic feet for the week ended September 4.
That figure was 4.4% above the five-year average, according to the same EIA dataset, keeping storage levels relevant to the near-term price outlook. The September 17 report is scheduled for release later Thursday, making it a key fundamental event for the commodity.
Production, weather forecasts, LNG demand and storage injections can all alter the balance between supply and consumption. Those factors matter because natural gas can move sharply when physical-market expectations change even if technical indicators remain neutral.
The current setup therefore leaves traders watching two separate triggers: a technical break outside the $2.88-$2.95 congestion zone and confirmation from volume and broader market participation.
Conclusion:
Natural gas remains compressed near $2.90, with the supplied 5-hour chart showing a range between roughly $2.80 and $3.00. The $2.95 area is the immediate resistance test, while the 200-period SMA near $2.817 provides a deeper structural reference. MACD has improved, but ADX at 18.68 shows that trend strength remains limited. The next major move will depend on whether buyers can clear $2.95-$3.00 or sellers push price below the $2.89-$2.80 support area, with the latest U.S. storage report adding an important fundamental catalyst.
Sources & Methodology
Primary-source standard: Market-moving facts should link to original data releases, regulator notices, company filings or official project announcements whenever available. Secondary reporting is used for additional context, not as a substitute for original evidence.
Page last reviewed: