
Ethereum (ETH) is trading around the $2,600–$2,700 area after retreating from its recent September recovery high. The pullback comes as broader risk assets face pressure from elevated oil prices and U.S. Treasury yields, even as U.S. spot Ether ETFs continue to attract fresh capital. At the same time, Ethereum’s development roadmap is approaching an important milestone, with the Sepolia testnet scheduled to fork for the Glamsterdam upgrade on October 6.
Glamsterdam Moves Toward Public Testing
According to the official Ethereum Glamsterdam roadmap, the Sepolia fork is scheduled for October 6, 2026. Glamsterdam is currently being tested on development networks, while its mainnet deployment remains targeted for Q4 2026 with no confirmed mainnet date.
The upgrade is focused on scaling Ethereum’s Layer 1 by improving transaction processing, increasing network capacity and making data management more efficient. Its planned changes include parallelization improvements, block-level access lists and modifications designed to support larger capacity without creating excessive hardware requirements.
The October testnet fork will therefore be an important technical checkpoint rather than confirmation that the mainnet upgrade is complete. Ethereum developers have already warned that Glamsterdam introduces changes that can affect wallets, indexers, gas estimators and other infrastructure.
ETF Demand Contrasts With ETH Weakness
Spot Ether ETF flows provide a different signal from price action. Data reported from SoSoValue’s Ethereum ETF tracker showed U.S. spot Ether ETFs recorded approximately $104.63 million of net inflows on September 23, extending the positive run to four consecutive trading sessions. BlackRock’s ETHA led with about $50.8 million, while Fidelity’s FETH attracted roughly $41.28 million.
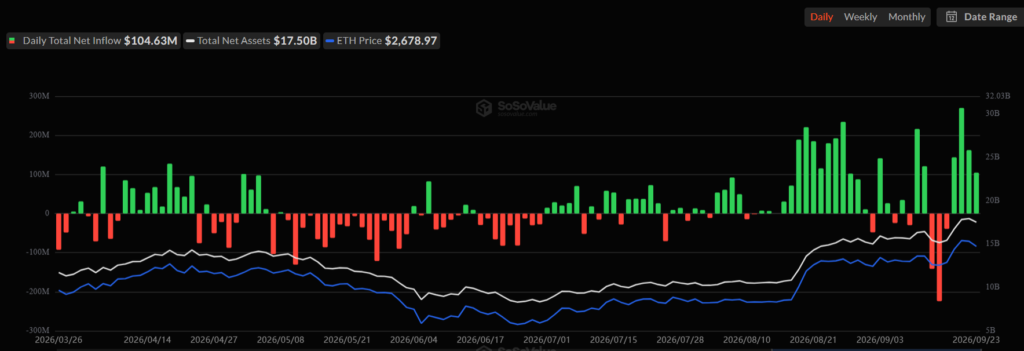
However, the broader weekly picture needs context. Ether ETFs recorded about $140 million in net outflows during the September 14–18 trading week, ending a four-week run of weekly inflows. The latest daily inflows therefore represent a renewed short-term improvement rather than an uninterrupted monthly trend.
This divergence shows that ETF demand alone has not prevented short-term volatility in ETH. Macro conditions, derivatives positioning and broader cryptocurrency selling can still influence the spot price.
ETH Price Levels in Focus
ETH recently reached roughly $2,786 before retreating toward the $2,600 region. Current market data place immediate support around $2,626–$2,672, while a deeper support zone sits near $2,544–$2,560.
If ETH holds the $2,600 area and buying pressure returns, the recent $2,786 high becomes the first major resistance zone. A sustained break above that level could bring the $2,900–$3,000 region into focus.
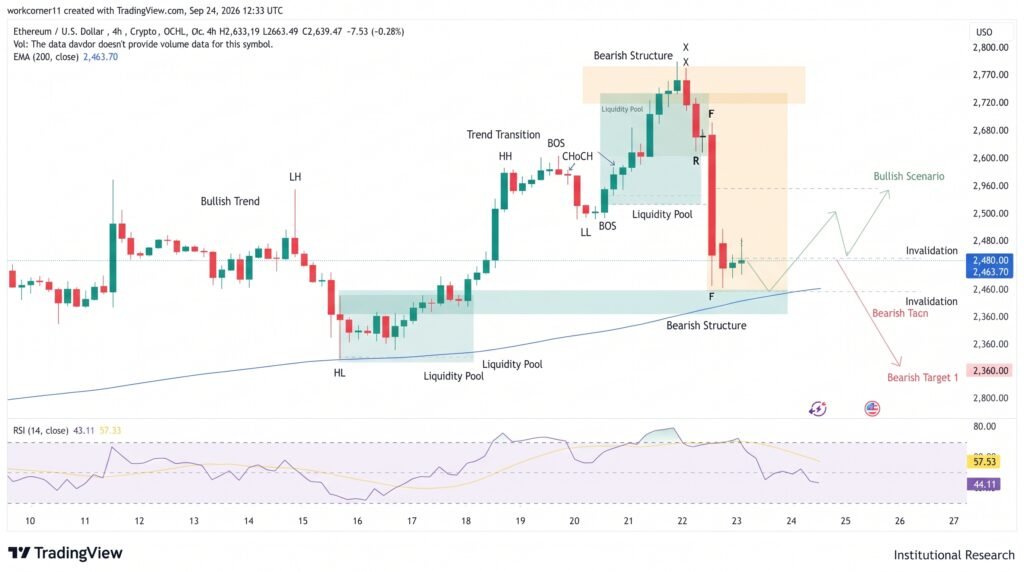
Conversely, a decisive move below the $2,544–$2,560 support cluster would weaken the short-term structure and could expose the $2,430 area.
Ethereum therefore enters the October 6 Glamsterdam testnet milestone with two opposing forces: renewed daily ETF inflows and a major network upgrade on one side, versus macro-driven risk pressure and a technical pullback on the other. The Sepolia test will provide an important development checkpoint, while ETH’s reaction around $2,600 should remain central to the near-term price outlook.
Sources & Methodology
Primary-source standard: Market-moving facts should link to original data releases, regulator notices, company filings or official project announcements whenever available. Secondary reporting is used for additional context, not as a substitute for original evidence.
Page last reviewed: