Natural Gas is holding above the important $3.02 level after a sharp advance, keeping the five-hour chart in a bullish structure. The supplied setup puts the latest price near $3.053, while current market data also shows natural gas around $3.05 on Sept. 24. Futures have climbed from $2.82 on Sept. 22 to above $3.05, marking a rapid recovery over two sessions. The next test is whether buyers can extend the breakout toward $3.10 and $3.14 without triggering a pullback.
Natural Gas Breakout Holds Above $3.02
The move through $3.02 marked an important technical development. In the supplied five-hour chart, a strong bullish candle cleared the resistance level, while price remained above the 200-period simple moving average near $2.83 and the SuperTrend level around $2.927.
Current technical data supports the broader bullish structure. Investing.com’s latest reading places the 200-period SMA near $2.91, while the MACD remains positive and the ADX is above 40, indicating a strong underlying trend.
- Breakout level: $3.02
- Immediate support: $2.98–$3.02
- Long-term trend support: around $2.91–$2.93
- First upside target: $3.10–$3.14
The MACD remains above its signal line in the latest technical data, while moving averages from 20-day through 200-day periods remain in buy territory.
$3.10 Becomes the Next Test
The $3.10 area is the first significant obstacle above the breakout. It corresponds with the upper Bollinger Band in the supplied setup and sits close to the next cluster of technical resistance.
A move through $3.10 would expose the $3.14 Fibonacci extension, followed by the $3.20 area. A stronger extension could bring the $3.37 historical supply zone into focus, although that would require the market to sustain momentum well above current levels.
The momentum indicators have not reached the same stretched condition as in the original chart. Current data shows RSI around 60–62, while ADX is above 40, leaving the market bullish without the RSI being at the traditional 70 overbought threshold.
That difference matters because a strong trend can continue even when short-term indicators begin to cool.
$2.95 Defines Breakout Risk
The $2.95 area remains an important technical line. A decline below it would raise questions about whether the move above $3.02 was a sustainable breakout or a temporary price spike.
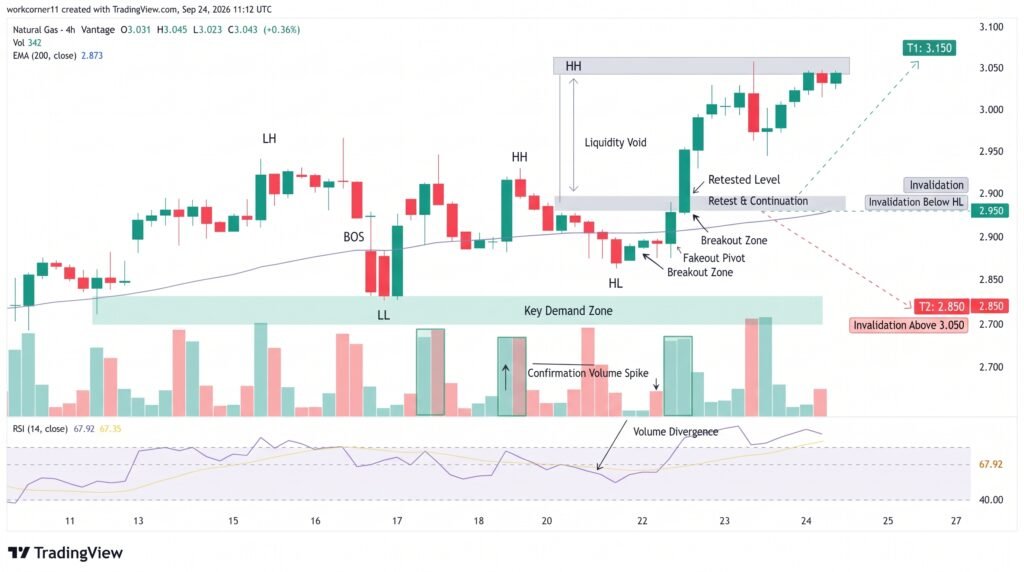
The $2.98–$3.02 zone is therefore likely to become the first area buyers need to defend. If price pulls back and holds this region, the former resistance could begin functioning as support.
Current ATR readings are relatively modest, around $0.014–$0.016 on the cited technical screens, although natural gas can move rapidly around supply, weather and inventory developments.
Conclusion:
Natural gas remains above the $3.02 breakout level, keeping the near-term chart structure constructive. The $3.10–$3.14 zone is the next major technical hurdle, while $2.98–$3.02 has become the key support area to monitor. A sustained move above $3.14 would expose higher levels, while a break below $2.95 would weaken the breakout structure and shift attention back toward the $2.91–$2.93 trend-support region.
Sources & Methodology
Primary-source standard: Market-moving facts should link to original data releases, regulator notices, company filings or official project announcements whenever available. Secondary reporting is used for additional context, not as a substitute for original evidence.
Page last reviewed: