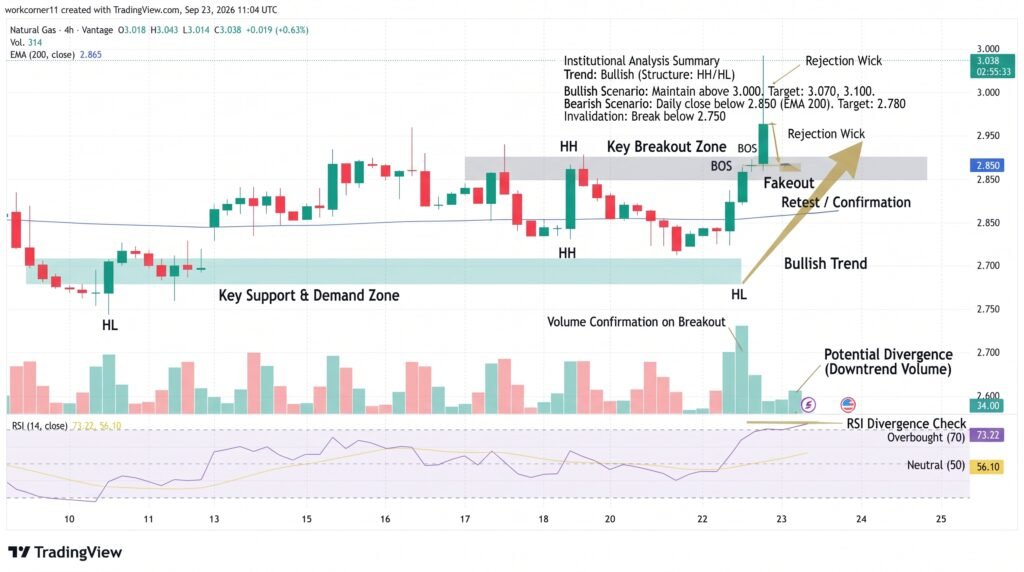
Natural gas prices are facing a sharp technical test after a powerful rally pushed the market more than 9% above its 20-period moving average. In the supplied five-hour chart snapshot, prices have retreated to $3.01 after reaching the $3.17 area, while momentum indicators had moved into overbought territory. The pullback follows a broader September recovery in which Micro Henry Hub futures climbed from $2.836 on September 21 to $2.965 on September 22, before trading around $3.01-$3.03 on September 23.
The technical picture is mixed rather than uniformly bearish. A retreat from an overextended rally can relieve stretched momentum without necessarily ending the broader uptrend. Current Investing.com data also shows the 200-period moving average near $2.89, keeping the longer-term structure above that level constructive.
Natural Gas Rally Meets Resistance
The five-hour setup shows natural gas briefly extending 9.1% above its 20-bar moving average, while the RSI reached 78.8. An RSI above 70 is generally interpreted as overbought, although it does not automatically signal that prices must reverse.
The formation of a hanging-man candlestick near $3.17 adds another warning to the short-term setup. The candle appeared after the rapid advance, while trading activity around the $3.20 region was described in the source setup as a volume climax. Together, those signals indicate that buying pressure may have become stretched.
- Five-hour price: $3.01
- Recent resistance: $3.17
- RSI peak: 78.8
- 200-period SMA: about $2.82 in the supplied chart
Investing.com’s latest technical snapshot also shows natural gas trading above its longer-term moving averages, with the 200-period SMA around $2.89 and the 20-period SMA near $3.04.
Key Levels After the Pullback
The $3.01 area is now important because it sits close to the 20-period moving-average region in the latest technical data. Holding this zone could allow buyers to attempt another move toward $3.17, the recent rally high.
A sustained break above $3.17 would put the recent surge back in focus. By contrast, failure to regain that level could leave the market vulnerable to a deeper retracement toward the $2.91 SuperTrend reference cited in the original chart setup and then toward the longer-term moving-average area.
The broader technical backdrop remains relatively strong. Investing.com’s current five-hour technical reading shows RSI near 61, MACD positive and all listed moving averages generating buy signals, although ADX remains elevated, indicating a strong directional market.
Gas Market Fundamentals Stay Relevant
Technical traders also need to watch the physical gas market. The U.S. Energy Information Administration identifies Henry Hub in Louisiana as the benchmark delivery point for its U.S. natural-gas price data.
Recent market developments are also keeping international gas markets active. Lithuania announced a 10-year agreement with EQT covering 10 LNG cargoes from 2027 through 2036, with the contract expected to cover about 40% of the country’s gas demand. The deal also introduces Henry Hub-linked pricing into the agreement.
For traders, the immediate issue is whether the retreat from $3.17 represents a normal consolidation or the beginning of a larger correction. The $3.01-$3.04 area is the first technical zone to monitor, while $3.17 remains the key upside reference. A break below longer-term support would materially change the structure.
Conclusion
Natural gas has moved from a powerful 9.1% rally into a technically sensitive phase. The retreat toward $3.01 follows an RSI reading of 78.8 and a rejection near $3.17, creating room for further consolidation. Still, the broader moving-average structure remains positive, with the 200-period average near $2.89 in current Investing.com data. Traders are therefore watching whether $3.01 holds and buyers regain $3.17, or whether the correction extends toward deeper support.
Sources & Methodology
Primary-source standard: Market-moving facts should link to original data releases, regulator notices, company filings or official project announcements whenever available. Secondary reporting is used for additional context, not as a substitute for original evidence.
Page last reviewed: