
Brent Oil has recovered after Monday’s sharp decline, with the supplied five-hour chart showing a rebound from $99.37 toward $101.66. The move comes as the market remains caught between renewed buying around the $99 area and technical pressure following the retreat from the recent $109.97 high.
Current market data confirms the importance of the $99 region. Brent crude fell below $100 on Monday, with Reuters reporting the benchmark at $99.51 during the session before Tuesday’s rebound. By Tuesday, Brent futures had risen 1.7% to $102.06 as investors assessed the possibility of U.S.-Iran talks.
The broader market also remains highly sensitive to geopolitical risk. Reuters reported that investors were watching potential U.S.-Iran discussions during the United Nations General Assembly, while continuing attacks in the Middle East kept supply concerns elevated.
That combination of geopolitical uncertainty and a technical rebound leaves the $99 support level central to the short-term outlook.
$99 Support Meets $103 Resistance
The five-hour structure shows Brent attempting to stabilize around the psychologically important $100 threshold. The supplied setup identifies the 38.2% Fibonacci retracement near $100.47 as an important reference, while repeated rebounds from the $99.37 low indicate buying interest around that area.
However, the recovery has not yet removed the broader technical pressure. The supplied chart shows a negative MACD reading near -0.98, while the SuperTrend and Ichimoku Cloud continue to identify overhead resistance.
Independent technical data on Sept. 22 showed a mixed setup. Investing.com listed Brent’s MACD at -0.610 with a sell signal, while the 200-period simple moving average was around $104.62. The 50-period SMA was near $102.37, leaving the market below several medium- and longer-term moving-average resistance levels.
Key levels remain:
- Critical support: $99.00
- Recent low: $98.98
- Fibonacci level: $100.47
- Immediate resistance: $103.30-$104.50
- Major moving-average resistance: Around $104.62
- Recent high: $109.97
A sustained move below $99.00 would weaken the rebound and expose lower technical levels. Conversely, a move through $103.30-$104.50 would challenge the bearish structure.
Double Top Keeps Downside Risk
The chart also continues to show a potential double-top formation around $109.97. The pattern remains incomplete because Brent has not yet confirmed a decisive break through the neckline area near $99.
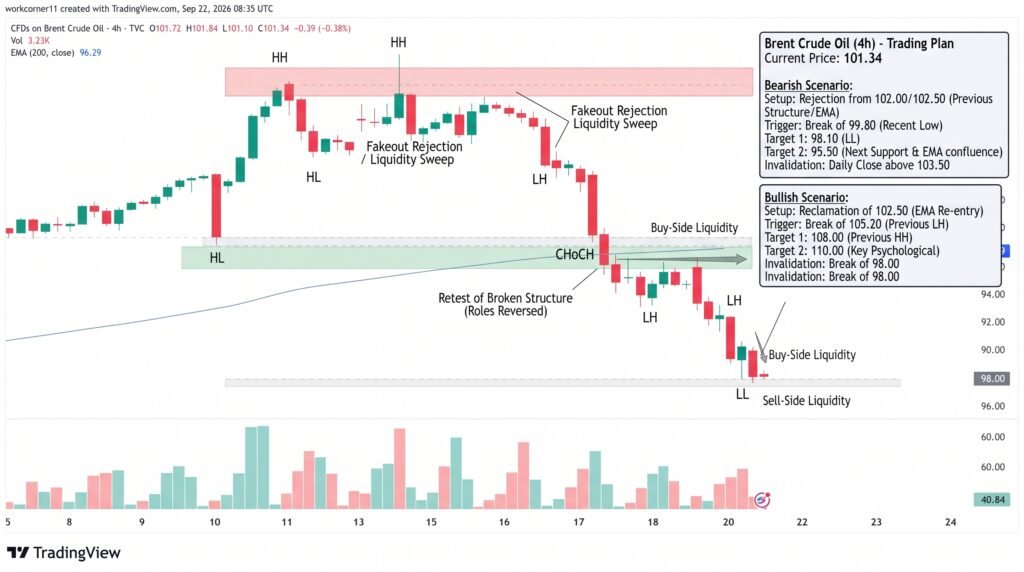
A confirmed move below $99 would strengthen the pattern and could shift attention toward the 200-period SMA near $92.50 identified in the supplied technical setup. That level would represent a substantial decline from the current price and would require continued selling pressure.
On the upside, failed rallies between $104.00 and $106.10 could create another rejection zone. Traders watching the pattern will therefore focus on whether Brent can build acceptance above $103 before attempting a larger recovery.
The fundamental backdrop remains equally important. Brent has been moving in response to developments around Middle East supply routes, while activity through the Strait of Hormuz remains a major consideration for global energy markets. Reuters reported that Saudi Arabia increased crude exports through the waterway after disruptions affected alternative shipment routes.
Investors are also monitoring developments involving Saudi Arabia and Yemen’s Houthi attacks, as well as potential diplomatic developments between the United States and Iran. These factors can influence expectations for crude supply and shipping conditions alongside the technical structure.
Conclusion
Brent’s rebound toward $101.66 has placed the market back above the $100 psychological level, but the technical structure remains unresolved. The $99 support is the key downside trigger, while $103.30-$104.50 forms the first major resistance band. A break below $99 would strengthen the potential double-top setup and bring the $92.50 200-SMA area into focus. A sustained move above $104.50, by contrast, would weaken the immediate bearish structure and put the higher resistance zones back on watch.
Sources & Methodology
Primary-source standard: Market-moving facts should link to original data releases, regulator notices, company filings or official project announcements whenever available. Secondary reporting is used for additional context, not as a substitute for original evidence.
Page last reviewed: