
West Texas Intermediate crude is testing the $94 area after a steep retreat from its recent $106.75 peak. The latest five-hour chart snapshot places WTI at $93.97, putting the market directly at a level that traders have repeatedly defended. WTI crude oil market data
The move follows an unusually volatile September. WTI futures reached $106.75 on Sept. 15 before falling to $99.53 by Sept. 18, according to historical market data. The decline has occurred as concerns about Middle East supply disruptions eased somewhat, although geopolitical risks remain significant.
WTI Falls From $106.75 Peak
The $106.75 high marked the upper boundary of a sharp rally driven by supply concerns. The move represented a 19-week high, with disruptions involving Saudi Arabia’s East-West pipeline adding pressure to global crude flows.
The subsequent reversal has changed the short-term technical picture. On the five-hour chart, WTI is trading below its 20-period simple moving average at $101.02 and 50-period average at $99.37. The market has also moved beneath the Ichimoku Cloud, indicating that recent selling pressure has weakened the previous bullish structure.
The chart’s double-top formation around $106.75 adds significance to the decline. From that peak to $93.97, the retreat is roughly 12%, leaving the $94 region as an important technical test.
$94 Support Holds Key Technical Risk
The immediate question is whether buyers can defend $94. A sustained five-hour close below that level would weaken the existing support structure and put lower Fibonacci retracement zones into focus.
- $94.00: Immediate support and breakdown trigger
- $91.58: 38.2% Fibonacci retracement
- $86.89: 50% Fibonacci retracement
- $98.50-$101.00: Potential rebound resistance
Momentum indicators remain mixed. RSI at 33.70 is close to oversold territory, which can precede a short-term recovery. However, the MACD remains negative at -1.21 versus a signal reading of -0.05, keeping downside momentum visible. An ATR of 2.08, or about 2.2% of price, also highlights elevated volatility.
Oil Outlook Hinges on the $94 Break
The broader oil market remains highly sensitive to developments affecting Middle East supply. Recent market reports showed WTI falling below $100 as diplomatic expectations improved, while Saudi Arabia worked to restore part of the capacity affected by pipeline damage.
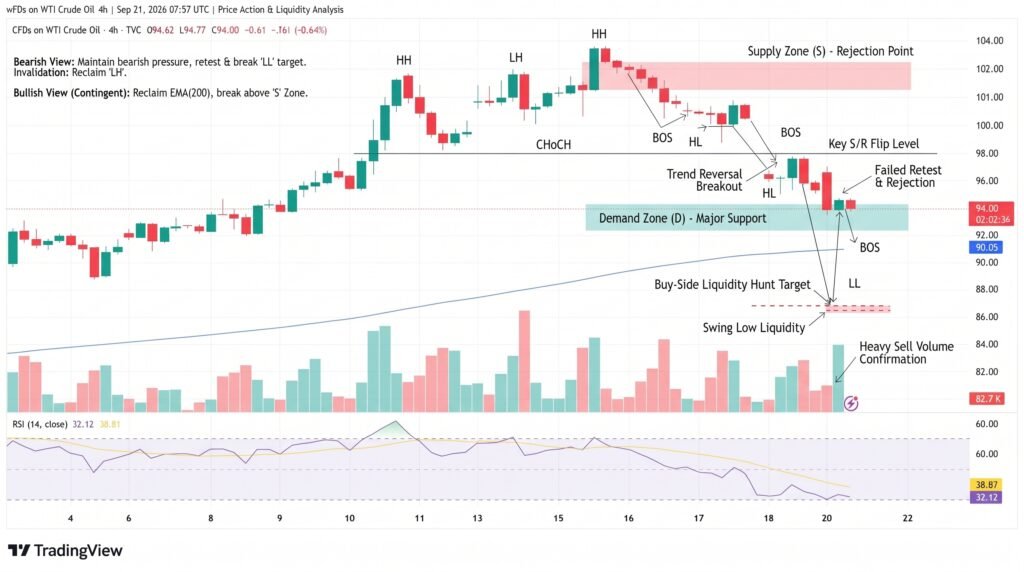
For the chart, however, $94 remains the immediate reference point. A confirmed break could expose $91.58 and then $86.89, while a firm defense could produce a rebound toward $98.50-$101.00.
The technical setup calls for confirmation rather than assumption. A move through $94 with stronger trading activity would reinforce the bearish structure, while a reversal accompanied by improving RSI would signal that buyers are attempting to stabilize the market.
Conclusion
WTI crude oil is at a critical technical juncture after falling about 12% from the $106.75 double-top area. The $94 support level is now the key line for the short-term trend. A decisive five-hour close below it would bring $91.58 and $86.89 into focus, while sustained buying could push prices back toward $98.50-$101.00. With RSI approaching oversold territory but MACD still negative, the next confirmed price move around $94 should provide the clearest indication of whether WTI is entering another leg lower or beginning a corrective rebound.
Sources & Methodology
Primary-source standard: Market-moving facts should link to original data releases, regulator notices, company filings or official project announcements whenever available. Secondary reporting is used for additional context, not as a substitute for original evidence.
Page last reviewed: