
Natural Gas is consolidating near $2.858 on the five-hour chart, with the market caught between long-term support around $2.815 and short-term resistance near $2.895. The narrow range shows a market without a clear immediate trend, as buyers defend the 200-period moving average while sellers continue to pressure prices below shorter-term indicators.
The latest futures market data place natural gas near $2.86 on September 18, after prices fell 1% on Thursday. U.S. Henry Hub spot prices recently moved from $2.71 on September 11 to $2.97 on September 15, highlighting the market’s recent volatility.
$2.815 Support Faces the Test
The supplied five-hour setup places the 200-period SMA at $2.815, making it the most important technical support in the current range. Price is still above that average, which keeps the broader structure from turning decisively bearish. A sustained break below it, however, would weaken the recovery structure and expose lower support.
The 20-period SMA near $2.895 remains the first major upside barrier. Natural gas is also trading below the supplied Ichimoku Cloud around $2.884–$2.895, indicating that buyers have yet to regain short-term trend control.
Momentum is mixed. The 14-period RSI around 44.60 remains below the neutral 50 threshold, suggesting that sellers retain a modest advantage but have not pushed the market into oversold territory. The MACD is also negative, reinforcing the weaker short-term picture.
The key technical levels are:
- Primary support: $2.815
- Secondary support: $2.821
- Range floor: $2.800
- Immediate resistance: $2.895
Storage Keeps the Market Balanced
Fundamentals are preventing the technical range from developing into a clear one-way move. U.S. natural-gas inventories reached 3.298 trillion cubic feet for the week ended September 11, according to the Energy Information Administration. Stocks have continued to build through late summer, creating a substantial supply cushion ahead of winter.
The EIA’s August outlook projected that Henry Hub prices would average about $2.87 per million British thermal units in the third quarter, citing robust production and reduced LNG feedgas demand. The agency also expected inventories to enter winter at their highest level in roughly a decade.
That supply picture is an important counterweight to international LNG disruptions. European gas storage is only about 69% full, compared with a five-year seasonal average of 85%, while Middle East disruptions have reduced available LNG cargoes.
For U.S. natural gas, however, the impact is partly offset by strong domestic production and substantial inventories. LNG export demand remains an important variable because stronger overseas prices can increase U.S. feedgas consumption.
Breakout Defines the Next Direction
The market’s next decisive signal should come from a break outside the current range. A sustained move above $2.895 would place the price back above the short-term moving-average and cloud resistance, improving the technical structure and opening room toward the upper end of the recent $2.96 range. A failure at that resistance would keep natural gas trapped between the two technical boundaries.
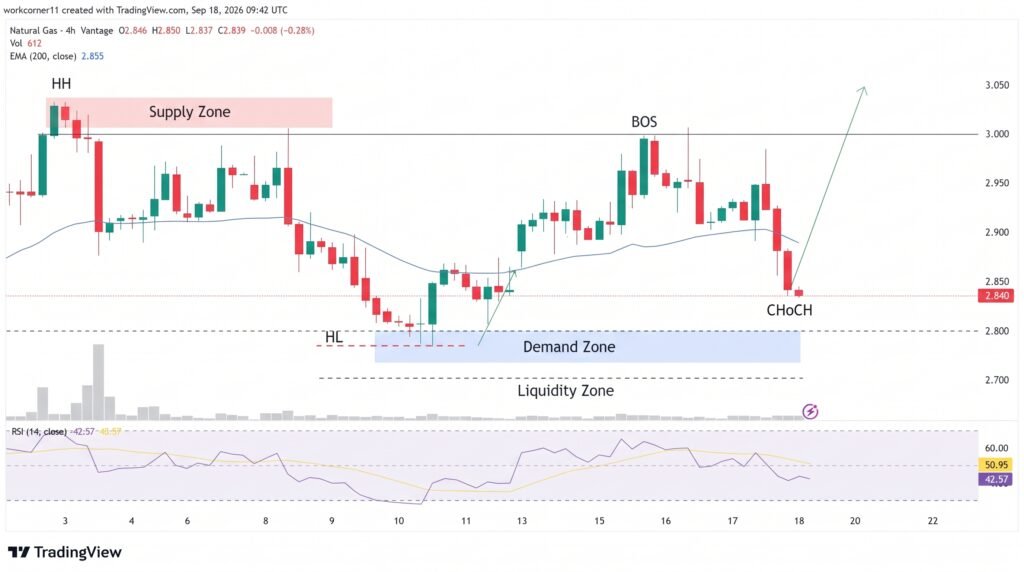
Conversely, a five-hour close below $2.815 would weaken the broader setup. The supplied chart identifies $2.821 as an intermediate downside reference, while $2.800 becomes the more important psychological and structural floor.
Fading volume and doji candles reinforce the lack of conviction. That makes confirmation particularly important because compressed markets can generate rapid false breaks before establishing a sustained trend.
Conclusion
Natural gas remains locked in a narrow technical range, with $2.815 acting as the critical support and $2.895 capping the upside. The 200-period SMA continues to provide structural support, but negative MACD and an RSI below 50 show that short-term momentum remains weak. Strong U.S. storage levels are limiting supply concerns, while tight European inventories and disrupted LNG flows provide an opposing fundamental force. A break above $2.895 would strengthen the recovery case, while a move below $2.815 would expose $2.821 and $2.800.
Sources & Methodology
Primary-source standard: Market-moving facts should link to original data releases, regulator notices, company filings or official project announcements whenever available. Secondary reporting is used for additional context, not as a substitute for original evidence.
Page last reviewed: