
WTI crude oil is consolidating near $100.22 on the five-hour chart, caught between resistance around $102.60 and a support cluster near $99.50–$98.60. The narrow range reflects a market that has lost short-term momentum after a sharp rally, while the broader trend remains supported by elevated geopolitical supply risks.
The latest Reuters market data put WTI crude near $100.08 on Friday, down 2% and heading for a third consecutive daily decline as Saudi Arabia began restoring some export capacity.
WTI Holds Above Key Support
The supplied five-hour chart shows WTI trading above its 50-period moving average and the SuperTrend near $99.51. That keeps the broader short-term structure intact as long as buyers defend the $98.60–$99.50 region.
The technical picture is less convincing on shorter horizons. The MACD remains below its signal line, while recent price action has produced lower highs and lower lows. Volume has also faded during the retreat, suggesting that the correction has not yet developed into a broad liquidation.
The 50% Fibonacci retracement near $98.60 adds another layer of support. A decisive break below that area would weaken the bullish structure and leave the market exposed to a deeper retracement.
The immediate technical map is:
- Resistance: $102.60
- Near-term support: $99.50
- Major support: $98.60
- Range: roughly $99.50–$102.00
Saudi Supply Eases, Hormuz Still Tense
The fundamental backdrop has shifted from an outright supply shock toward a more balanced but still fragile market. Reuters reported Friday that Saudi Arabia is restoring pipeline capacity and increasing Gulf exports through alternative arrangements, helping push oil prices lower. Saudi Aramco plans to export about 60 million barrels from its Ras Tanura port during September and October, according to trading sources.
That additional supply is arriving as traffic through the Strait of Hormuz remains severely depressed. Preliminary Kpler data showed only four commodity vessels crossed the waterway on Thursday, compared with a 10-day average of 16.
The combination leaves oil vulnerable to sharp two-way moves. Improving exports can pressure prices lower, while any renewed shipping disruption could quickly revive the risk premium.
U.S. production provides another supply cushion. The Energy Information Administration expects U.S. crude output to average a record 13.8 million barrels per day in 2026, up from the previous record of 13.7 million bpd in 2025.
$102.60 Break or $98.60 Failure
For bulls, the first technical requirement is a sustained move through $102.60. A confirmed five-hour close above that ceiling would show that buyers have absorbed the recent selling and could reopen the path toward the recent highs.
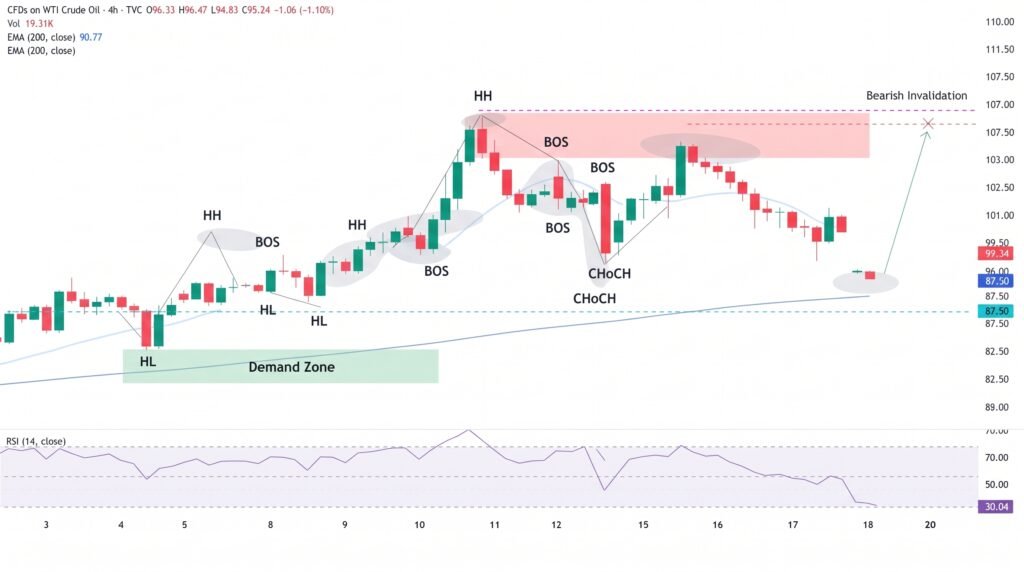
The bearish case strengthens below $98.60. That level combines the supplied Fibonacci retracement with the broader support cluster, so a clean break would represent a more significant change in structure rather than ordinary range trading.
The current $99.50–$102.00 area remains vulnerable to whipsaws. Traders should distinguish between intraday probes and confirmed closes because oil’s recent volatility has produced rapid reversals when supply headlines change.
Conclusion
WTI is consolidating near $100.22, with $102.60 limiting the upside and $99.50–$98.60 protecting the downside. The technical setup shows fading short-term momentum, but the broader structure remains supported while price holds above the major support cluster. Saudi Arabia’s efforts to restore exports are easing supply pressure, yet weak Strait of Hormuz traffic keeps geopolitical risk elevated. A break above $102.60 would strengthen the recovery case, while a sustained move below $98.60 would increase the risk of a deeper correction.
Sources & Methodology
Primary-source standard: Market-moving facts should link to original data releases, regulator notices, company filings or official project announcements whenever available. Secondary reporting is used for additional context, not as a substitute for original evidence.
Page last reviewed: