
Brent crude is testing a critical technical support area near its 200-day simple moving average (SMA) at $105.24 after a sharp rejection from $117.45. The decline has strengthened the bearish chart structure, with the SuperTrend and MACD pointing lower. However, a deeply oversold Money Flow Index (MFI) and a doji candle near support suggest selling pressure could be losing momentum. The next move may depend on whether buyers defend the $102.50–$103.50 zone or sellers force a deeper retracement.
Double top keeps Brent under pressure
The rejection around $117.45 has formed a completed double-top pattern, a technical formation that can signal a reversal after an extended advance. The pattern indicates that buyers struggled to push prices through the same resistance area twice, allowing sellers to regain control.
Brent is now trading near $104.52, below the Ichimoku cloud, which spans $105.78 to $109.12. The cloud acts as an overhead resistance area and reinforces the weaker market structure. The SuperTrend indicator is also bearish at $110.25, while the MACD reading of -1.90 remains below its signal line at -1.46. This configuration suggests negative momentum is still dominant.
The chart’s Fibonacci retracement levels provide additional downside references. Measured from $117.45 to $79.20, the 38.2% retracement is near $102.84, while the 50% level sits around $98.33. These levels may attract buying interest if Brent breaks below its immediate support.
$105.24 support faces a critical test
The 200-day SMA at $105.24 is the immediate dynamic support reference in the supplied chart. Brent’s proximity to the volume-weighted average price (VWAP) at $103.75 also suggests the market is approaching an area where trading activity could influence short-term direction.
The Money Flow Index has fallen to 15.64, a reading commonly considered oversold. Unlike the RSI, MFI incorporates both price and volume. Such a low reading can indicate intense selling, but it does not confirm that a reversal has begun.
A doji candle recorded near $103.76 on November 4 adds another signal to monitor. A doji reflects a close near the opening price and often indicates indecision. Its significance depends on confirmation from subsequent price action.
Key levels from the chart include:
- Immediate support: $102.84–$102.80.
- Bullish invalidation: $110.25.
- Deeper support: $98.33.
- Initial resistance: $105.78–$109.12.
- Bearish invalidation: $102.50.
Average True Range (ATR) stands at 2.04, or approximately 1.95%, indicating that daily price swings remain substantial.
Brent outlook: Two scenarios to watch
The bearish case remains dominant while prices stay below the $108–$110.25 resistance region. A recovery into this area could encounter selling pressure from the Ichimoku cloud and SuperTrend level. A sustained move above $110.25 would weaken the bearish setup and require traders to reassess the trend.
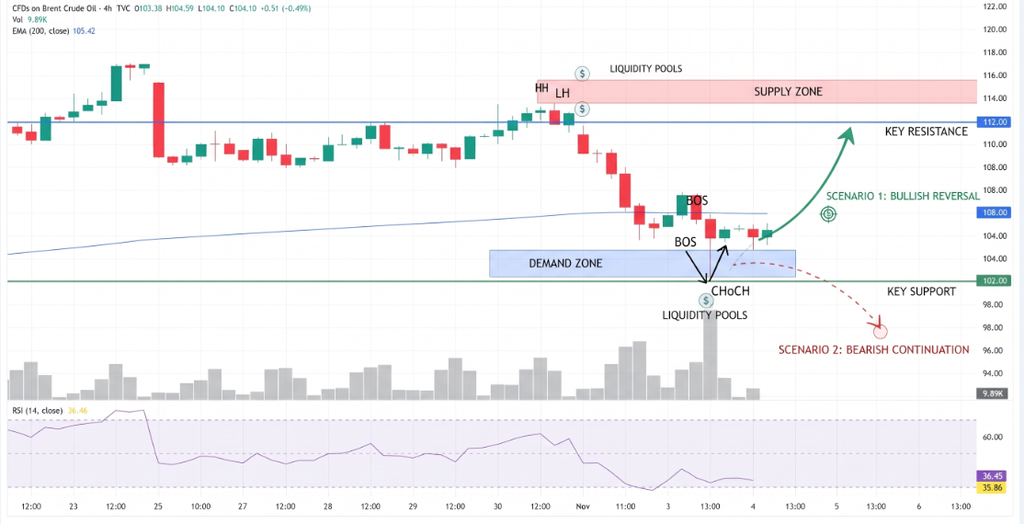
Conversely, a decisive break below $102.50 would expose the $98.33 Fibonacci level. The chart identifies $102.50–$103.50 as a potential demand zone, but buyers would need to defend it to prevent a deeper decline.
The $104–$107 range is identified as a no-trade consolidation area in the supplied dashboard, reflecting the risk of choppy price action around the 200-day average.
Conclusion
Brent’s technical structure remains bearish after rejection at $117.45, but oversold money flows and the doji near $103.76 leave room for a short-term pause. A break below $102.50 would strengthen the downside case, while a recovery through $110.25 would challenge the prevailing bearish outlook.
Sources & Methodology
Primary-source standard: Market-moving facts should link to original data releases, regulator notices, company filings or official project announcements whenever available. Secondary reporting is used for additional context, not as a substitute for original evidence.
Page last reviewed: