Natural gas is holding near $2.878 on the 5-hour chart as a tight range develops between short-term moving-average resistance and longer-term support. The setup leaves the market vulnerable to a sharp move once price breaks from the current range. The immediate technical boundaries are $2.910 on the upside and $2.810 on the downside. Meanwhile, U.S. storage remains an important fundamental variable, with working gas inventories at 3,298 billion cubic feet (Bcf) as of Sept. 11, according to the latest EIA data.
Natural Gas Holds a Tight Range
The latest Natural Gas price action shows the market trading around $2.878, close to several important moving averages. The 20-period simple moving average stands at $2.896, while the 50-period SMA is at $2.883. Both levels are immediately above the current price and create a nearby resistance cluster.
The longer-term 200-period SMA is positioned at $2.814, giving the market a much wider reference point on the downside. Price has recently moved within a broader $2.814-$2.960 range, while a Doji candlestick around $2.872 on Sept. 21 reflects the lack of directional conviction.
The technical picture is also mixed. The MACD remains bearish, with the MACD line below its signal line, while the RSI reading of 47.39 sits below the neutral 50 threshold.
- Immediate resistance: $2.883-$2.896
- Major resistance: $2.910
- Long-term support: $2.814
- Breakdown trigger: $2.810
Storage and Demand Add Context
Technical signals are developing against a market shaped by supply, weather and power-sector demand. The EIA reported 3,298 Bcf of working gas in Lower 48 storage for the week ended Sept. 11.
Recent market coverage also points to strong power-sector consumption and LNG feedgas demand, while elevated U.S. production continues to limit upside pressure on prices. Natural gas futures settled at $2.912 on Sept. 18 after gaining 2.9% for the week.
That combination leaves traders watching whether demand can absorb abundant supply as the market moves deeper into the shoulder season.
$2.910 and $2.810 Define Next Move
The $2.850-$2.900 region remains technically congested, making false moves more likely before a decisive breakout. A sustained close above $2.910 resistance would clear the immediate resistance structure and shift attention toward the upper end of the recent range near $2.960.
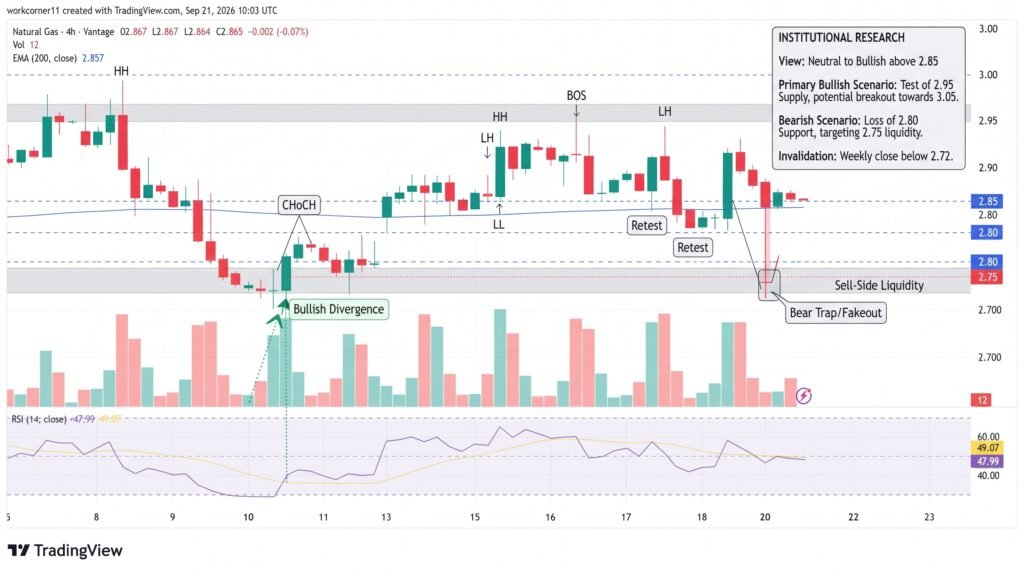
Conversely, a decisive break below $2.810 support would place the 200-period SMA under pressure and weaken the current consolidation structure. Until either threshold gives way, the market remains caught between competing signals.
For traders monitoring Natural Gas Futures, volume and follow-through are critical. A breakout accompanied by stronger participation would provide more confirmation than an isolated intraday move.
Conclusion
Natural gas remains compressed near $2.878, with the $2.910 resistance and $2.810 support levels defining the key technical boundaries. Momentum indicators currently provide mixed signals, while storage, production, LNG demand and weather remain important fundamental drivers. A sustained break above $2.910 could shift attention toward $2.960, while a move below $2.810 would weaken the current structure. Until either level breaks decisively, price action around the middle of the range remains vulnerable to volatility and false moves.
Sources & Methodology
Primary-source standard: Market-moving facts should link to original data releases, regulator notices, company filings or official project announcements whenever available. Secondary reporting is used for additional context, not as a substitute for original evidence.
Page last reviewed: