Silver is trading around $66.40 an ounce, with the market caught between key technical levels at $64.70 support and $67.80 resistance. The narrow range has reduced short-term volatility and left traders watching for a decisive move. The latest five-hour chart shows silver holding above its 200-period simple moving average near $64.69, while momentum indicators remain mixed.
The setup comes as the broader silver market remains unusually volatile. The Silver Institute expects the global silver market to remain in deficit in 2026, while physical investment is forecast to increase. That underlying supply-demand backdrop could remain relevant if technical buying returns after a confirmed breakout.
Silver Price Tests Key Technical Range
The immediate focus is the $64.70-$67.80 zone. Silver has been unable to establish a sustained move above $67.80, while declines toward $64.70 have attracted support. This creates a clearly defined technical range for traders monitoring XAG/USD.
The 200-period SMA at approximately $64.69 strengthens the lower boundary because it provides a widely followed reference for the medium-term trend. Meanwhile, the Ichimoku Cloud is positioned around $65.84-$66.05, placing current prices close to an important area of technical balance.
A doji formation and declining trading volume indicate hesitation rather than a confirmed directional move. The $66-$67 area therefore remains vulnerable to false breaks before a stronger trend develops.
Momentum Signals Remain Mixed
Several indicators are sending different signals. The MACD shows a bullish crossover, with the cited readings at approximately 0.50 versus 0.35, suggesting improving short-term momentum. However, silver remains below its SuperTrend resistance, while the ADX reading of 20.75 points to relatively limited trend strength.
The market also remains below its earlier peak near $71.16, leaving a pattern of lower highs in place. Until that structure changes, a move through $67.80 would need follow-through to demonstrate that buyers have regained control.
The ATR of 0.95 highlights the metal’s ability to make substantial intraday swings. A breakout accompanied by expanding volume would therefore carry greater technical significance than a move occurring on thin participation.
Levels That Could Define the Next Move
For traders and investors, the most important question is whether silver can escape the current compression zone. A sustained move above $67.80 would place the recent lower-high structure under pressure, while a break below $64.70 would weaken the current support structure.
The broader fundamentals provide additional context. The Silver Institute projects a 67 million-ounce market deficit in 2026, despite higher overall supply, while physical investment is forecast to rise 20% to 227 million ounces.
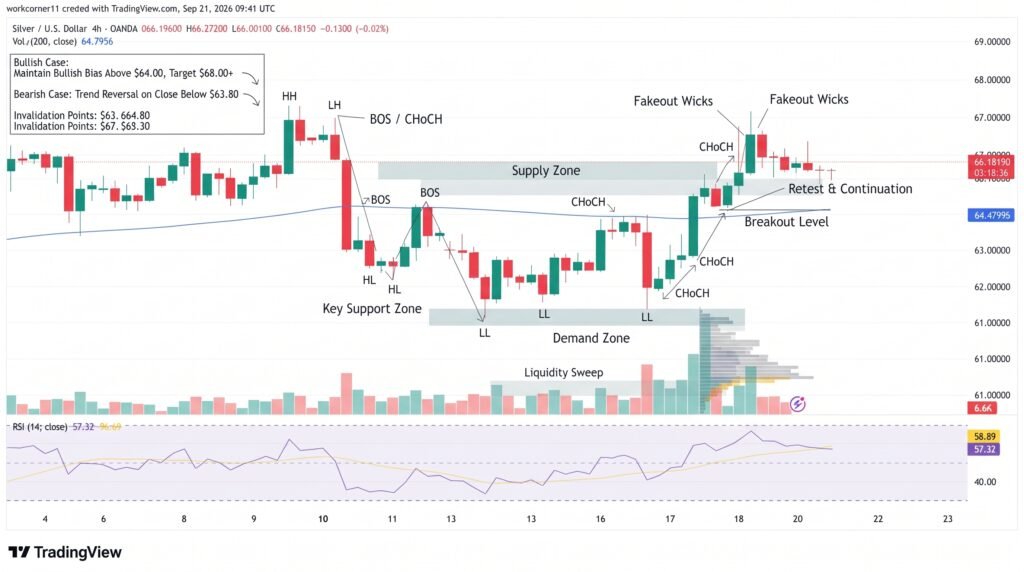
Key levels to monitor include:
- $67.80: Immediate resistance and upside breakout trigger.
- $64.70: Major support and downside trigger.
- $65.84-$66.05: Ichimoku Cloud support zone.
- $64.69: 200-period SMA reference.
- 0.95: ATR, indicating elevated normal price swings.
Conclusion
Silver’s $66.40 price places the metal near the center of a tightly defined technical range. Momentum is improving in some indicators, but weak trend strength, declining volume and the sequence of lower highs argue for confirmation rather than anticipation. A decisive move beyond $67.80 or below $64.70, particularly with stronger volume, would provide clearer evidence of the next directional phase. Until then, silver remains in a consolidation pattern where false breakouts and rapid reversals remain possible.
Sources & Methodology
Primary-source standard: Market-moving facts should link to original data releases, regulator notices, company filings or official project announcements whenever available. Secondary reporting is used for additional context, not as a substitute for original evidence.
Page last reviewed: