
Zcash (ZEC) is holding above $1,500 after gaining more than 40% last week, extending a sharp recovery across the privacy-coin market. The rally has coincided with strong institutional demand for the Grayscale Zcash ETF (ZCSH), while traders are also watching the upcoming NU7 network upgrade. ZCSH has accumulated roughly $914.53 million in assets, while ZEC futures open interest has reached record levels.
The combination of ETF demand and expectations for faster network confirmations has strengthened the fundamental backdrop. However, ZEC’s rapid advance has also pushed momentum indicators into stretched territory, leaving the market vulnerable to a correction if buying pressure weakens.
ZCSH Split and NU7 Upgrade
The ZCSH ETF has attracted more than $233 million in cumulative inflows since its Aug. 25 launch, according to market reports. Grayscale has also announced a 3-for-1 forward share split, with shareholders of record on Sept. 28 receiving two additional shares for every share held. Split-adjusted trading is expected to begin Sept. 30. The split changes the number of shares and their per-share price but does not change an investor’s total investment value.
Meanwhile, Zcash developers are targeting Nov. 5 for the NU7 upgrade, subject to the final activation decision scheduled for Oct. 20. Testnet activation is planned for Oct. 6. The upgrade would reduce target block spacing from 75 seconds to 25 seconds, potentially shortening the time required for transaction confirmations.
Key NU7 developments include:
- 25-second target block spacing, down from 75 seconds.
- Network Sustainability Mechanism and changes to transaction rules.
- The existing halving schedule is intended to remain intact.
The faster block interval does not mean ZEC issuance will triple. The proposed changes reduce the reward per block to account for the higher number of blocks produced over time.
ZEC Technical Outlook
ZEC remains above its 50-day exponential moving average near $965 and its 200-day EMA around $603, keeping the broader trend firmly above its longer-term averages. On the daily chart, however, the Relative Strength Index is near 70 and declining while price continues to rise, creating a bearish divergence that signals weakening momentum.
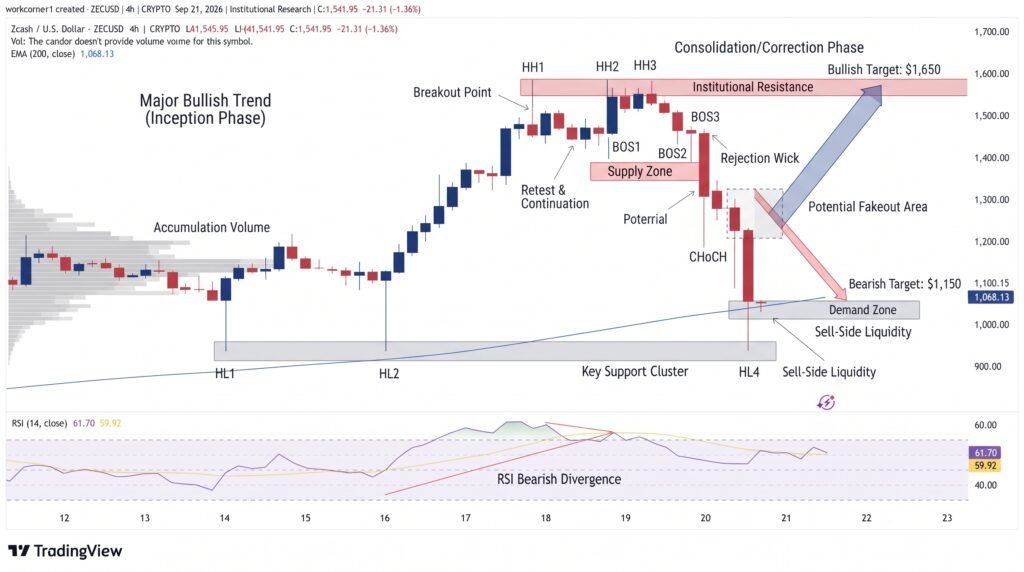
The Moving Average Convergence Divergence indicator remains positive, showing that buyers still control the broader trend. On the four-hour chart, ZEC is also above its 50-period EMA near $1,365 and 200-period EMA around $1,059.
For the bullish structure to continue, ZEC needs to clear Friday’s high near $1,595, followed by resistance around $1,653. A sustained break above that area would place the market into a new price-discovery phase.
On the downside, initial support stands near $1,422, followed by the $1,365 four-hour EMA. A deeper decline could expose $1,296, while the $1,050-$1,059 region represents a more significant support cluster.
Conclusion:
ZEC’s move above $1,500 combines strong ETF demand, elevated derivatives activity and expectations surrounding the NU7 upgrade. The technical structure remains constructive while price holds above its major moving averages, but the declining RSI against rising prices highlights increasing momentum risk. The $1,595-$1,653 area is the key upside zone, while $1,422 and $1,365 provide the first levels to monitor if selling pressure increases.
Sources & Methodology
Primary-source standard: Market-moving facts should link to original data releases, regulator notices, company filings or official project announcements whenever available. Secondary reporting is used for additional context, not as a substitute for original evidence.
Page last reviewed: