
Silver remains confined between important technical boundaries, with the supplied five-hour chart showing $65.78 between support near $64.00 and resistance around $67.80. The setup points to consolidation rather than a confirmed directional trend.
Live market references on Sept. 22 place spot silver broadly around the mid-$60s. Kitco showed a spot bid near $65.84, while Investing.com data recorded a session range around $66.27-$66.82.
The technical picture is therefore important because silver has recently shown substantial volatility. Investing.com data shows XAG/USD climbed from a September low near $62.31 on Sept. 16 to above $67 on Sept. 21.
That movement leaves traders watching whether the metal can establish itself above the upper end of the current range or retreat toward its lower boundary.
$64 Support Meets $67.80 Resistance
The five-hour structure places the 200-period simple moving average (SMA) around $64.83, making the $64-$64.50 area an important support region. A sustained move beneath that zone would weaken the existing technical structure and bring lower levels into focus.
Meanwhile, the 20-period SMA near $66.05 represents an immediate barrier. The supplied chart also places the Ichimoku Cloud around $65.84-$65.93, creating another layer of resistance close to current prices.
Recent market data shows silver has repeatedly traded through the mid-$60s, with Sept. 21 reaching an intraday high of $67.075 before easing.
Key levels traders are monitoring include:
- Support: $64.00-$64.50
- 200-SMA: $64.83
- Immediate resistance: $66.05-$66.50
- Range ceiling: $67.80
- Higher target: $71.16
A decisive close above $67.80 would provide stronger evidence that buyers are overcoming the current supply zone. Conversely, a break below $64.50 would shift attention toward lower technical supports.
Breakout Levels Define Next Move
For bulls, a sustained recovery above $66.50 would improve the short-term technical picture, particularly if silver subsequently clears $67.80. A confirmed breakout could expose the recent swing-high region near $71.16, although momentum would need to support the move.
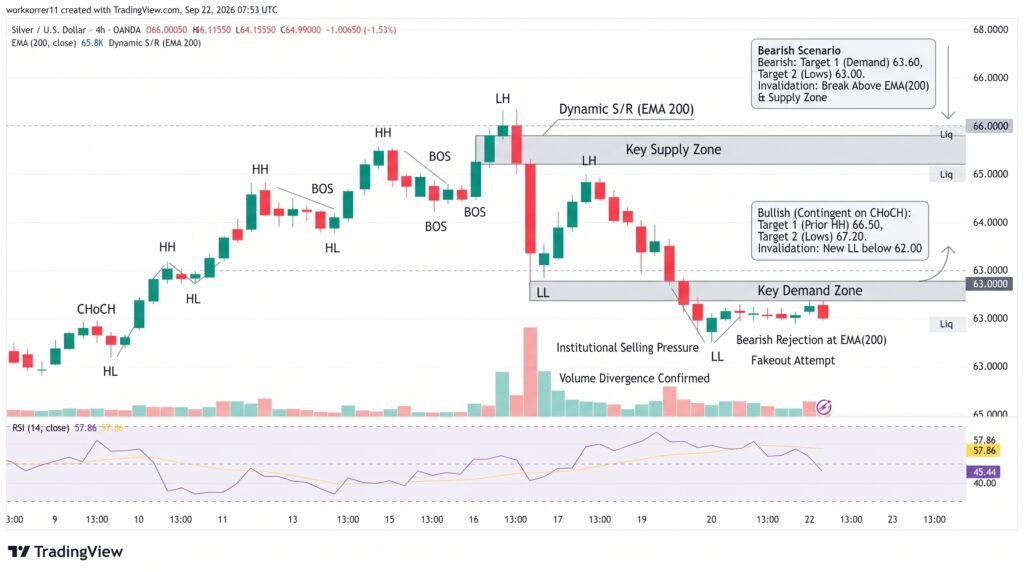
For bears, weakness below $64.50 would place the $63.50 structural level on watch. A deeper decline could bring the 61.8% Fibonacci retracement near $61.20 into focus, followed by the broader $58 area identified in the supplied technical setup.
The broader backdrop remains sensitive to monetary policy. Reuters reported Tuesday that silver was down about 1.1% to $65.28, as precious metals faced pressure from expectations that U.S. interest rates could remain elevated.
Conclusion
Silver’s five-hour structure remains defined by a clear $64-$67.80 range. Until price breaks decisively beyond either boundary, the market remains vulnerable to reversals around the middle of the range. A move above $67.80 would shift attention toward $71.16, while a break below $64.50 could expose $63.50 and $61.20. The $64.83 200-period SMA remains a key technical reference for assessing whether the current consolidation is holding or beginning to deteriorate.
Sources & Methodology
Primary-source standard: Market-moving facts should link to original data releases, regulator notices, company filings or official project announcements whenever available. Secondary reporting is used for additional context, not as a substitute for original evidence.
Page last reviewed: