
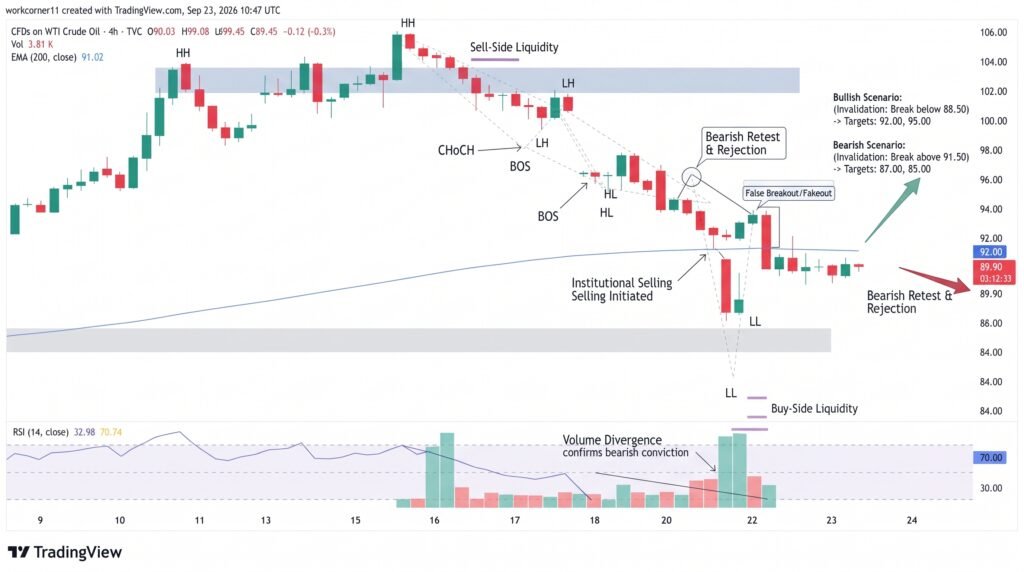
WTI crude oil is trading near $89.48, with the five-hour chart showing an RSI of 29.3, a level commonly associated with oversold conditions. The move comes after a sharp decline in crude prices, with WTI futures recording a September 23 low of $89.48 in Investing.com’s historical data.
The technical setup highlights a conflict between persistent selling pressure and the possibility of a short-term rebound. WTI remains below key moving averages, while improving Gulf supply prospects and hopes for progress in U.S.-Iran diplomacy have added pressure to prices. Reuters reported WTI around $90.02 on September 23, near a more-than-two-week low.
WTI Tests Oversold Territory
The WTI Crude Oil chart shows the five-hour RSI at 29.3, placing momentum below the traditional 30 threshold. An RSI reading below 30 does not by itself confirm a bottom; prices can remain oversold while a broader downtrend continues.
WTI is also trading well below its 20-period moving average, with the source setup showing a 6.12% negative extension. The 200-period SMA at $87.81 therefore becomes an important technical reference. A sustained move toward that area would place longer-term trend support under pressure.
- RSI: 29.3
- WTI price: $89.48
- 200-period SMA: $87.81
- Bollinger Band: $85.77
The broader trend remains weak. An ADX reading of 37.97 indicates a strong directional move, while the cited SuperTrend and Ichimoku Cloud signals remain bearish.
Key Levels for WTI Traders
The first important upside reference is $91.60, identified by the 38.2% Fibonacci retracement. A recovery toward that level would provide a clearer test of whether sellers remain in control after the latest decline.
On the downside, $87.81 represents the key 200-period SMA. A decisive break could expose the $86.90 area, while the lower Bollinger Bands reference near $85.77 provides another downside marker.
The original technical setup identifies $94.66 as an important invalidation area for bearish positions. These levels should be treated as chart references rather than guaranteed turning points.
Supply Signals Pressure Crude
The technical weakness is also being reinforced by fundamental developments. Reuters reported that oil remained near two-week lows as Gulf crude supplies improved and hopes increased for a diplomatic resolution involving Iran.
Saudi Arabia has also been working to restore its East-West pipeline, a route capable of moving as much as 7 million barrels per day and designed to bypass the Strait of Hormuz. These developments have reduced some of the immediate supply-risk premium embedded in crude prices.
For WTI, the combination of RSI 29.3, strong directional momentum and nearby $87.81 support creates a technically sensitive zone. A rebound toward $91.60 would test whether the market can recover after the selloff, while a sustained break below $87.81 would keep attention on lower support levels.
Conclusion
WTI’s move toward $89.48 has pushed the five-hour RSI into oversold territory, but the broader technical structure remains bearish. The $87.81 200-period SMA is the key nearby support, while $91.60 marks the first major rebound level. With supply conditions improving and geopolitical risk premiums easing, traders are watching whether oversold momentum produces a technical bounce or another leg lower.
Sources & Methodology
Primary-source standard: Market-moving facts should link to original data releases, regulator notices, company filings or official project announcements whenever available. Secondary reporting is used for additional context, not as a substitute for original evidence.
Page last reviewed: