
Solana (SOL) is holding near $120 on Monday after four consecutive sessions of gains, but the recovery is losing some institutional support. Weekly inflows into SOL-focused exchange-traded funds fell sharply to $2.43 million from $188.22 million previously, a decline of about 98.7%. Despite the weaker ETF demand, Solana’s underlying network activity remains firm, while the four-hour chart continues to show a mildly bullish triangle structure.
The immediate technical battle is centered between support near $119 and resistance around $123. A confirmed break above the upper boundary could put $124.95 and eventually $132.87 in focus.
SOL ETF Inflows Lose Momentum
Institutional demand for Solana investment products cooled substantially last week. Data from SoSoValue shows SOL-focused ETFs attracted $2.43 million, compared with $188.22 million the previous week. Although the latest reading marked the 14th consecutive week of net inflows, the dramatic reduction shows that the pace of institutional buying has weakened.
The decline matters because sustained ETF inflows can provide a direct source of demand for an underlying cryptocurrency. A slowdown does not necessarily signal a reversal, but it removes one of the stronger recent catalysts behind SOL’s recovery.
Network activity, however, provides a contrasting picture. Data from SolanaFloor showed Solana’s decentralized-exchange (DEX) volume on Sunday exceeded the combined volume of Ethereum’s mainnet, its Layer-2 networks and Hyperliquid.
Activity involving real-world assets (RWAs) is another developing factor. More than $4.4 billion in trading volume involving tokenized stocks was recorded on Solana, highlighting the network’s expanding connection with traditional financial markets.
$123 Resistance Caps SOL Recovery
The technical structure remains constructive. SOL is trading above its 50-, 100- and 200-period Exponential Moving Averages (EMAs) on the four-hour chart, located around $119.24, $116.43 and $110.44.
An ascending support trendline near $119.16 is also helping contain downside pressure. Meanwhile, a descending resistance trendline near $123 has created a narrowing range, producing the triangle formation.
Momentum indicators remain moderately positive. The Moving Average Convergence Divergence (MACD) is slightly above zero, while the Relative Strength Index (RSI) near 54 indicates positive momentum without an overbought reading.
A sustained move through $123 would bring September’s $124.95 high into focus. Clearing both levels would provide stronger confirmation of the bullish continuation setup.
- Current area: Around $120
- Triangle resistance: Near $123
- September high: $124.95
- Daily RSI: Near 54
$132.87 Becomes Upside Target
The next major upside objective comes from the Fibonacci retracement structure measured from $95.82 to $124.95. The 127.2% Fibonacci extension stands at $132.87, making it a potential target if SOL decisively clears the $123-$124.95 resistance zone.
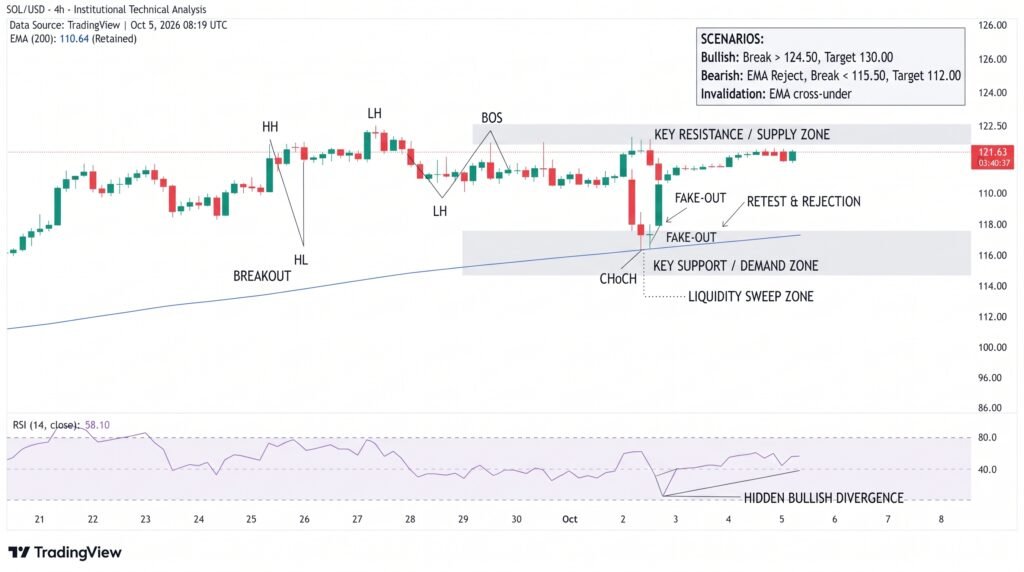
The downside remains defined by several closely positioned technical levels. Immediate support sits around the 50-period EMA at $119.25, reinforced by the rising trendline near $119.16 and the 78.6% Fibonacci retracement at $118.71.
A break below that cluster would weaken the triangle setup and expose the 100-period EMA around $116.43. A deeper decline could then bring the 200-period EMA near $110.44 back into view.
For now, SOL remains above all three major four-hour EMAs, keeping the broader recovery structure intact despite the sharp slowdown in ETF inflows.
Key levels to watch:
- Immediate support: $119.16-$119.25
- Secondary support: $116.43
- Initial resistance: $123
- Breakout confirmation: $124.95
- Potential upside target: $132.87
Conclusion
Solana’s setup is increasingly dependent on whether strong network activity can offset weaker institutional flows. ETF inflows plunged nearly 99% last week, but the 14-week streak of positive flows remains intact and on-chain market activity continues to provide support. Technically, the $119 area is crucial for maintaining the bullish triangle. A sustained break above $123 and $124.95 would strengthen the recovery and open the path toward $132.87, while a failure below $118.71 would weaken the near-term bullish structure.
Sources & Methodology
Primary-source standard: Market-moving facts should link to original data releases, regulator notices, company filings or official project announcements whenever available. Secondary reporting is used for additional context, not as a substitute for original evidence.
Page last reviewed: