Ripple’s XRP and Stellar’s XLM remained under pressure on Tuesday, trading around $1.30 and $0.168, respectively, as both cryptocurrencies struggled to regain key technical levels. Weak derivatives positioning and bearish on-chain signals point to cautious sentiment, while positive funding rates suggest some traders are still betting on a recovery. XRP also faces uncertainty over institutional demand. With both tokens trading below major moving averages, their nearest support levels are becoming increasingly important for determining whether the recent declines will deepen.
Derivatives Data Signals Cautious Sentiment
Data cited from CoinGlass showed XRP’s long-to-short ratio at 0.77 and XLM’s at 0.91. Both readings were below one, indicating that short positions outweighed long positions within the measured accounts. Such ratios can signal bearish positioning, although they do not guarantee that prices will fall.
Funding rates offered a contrasting signal. XRP’s rate stood at 0.0100%, while XLM’s reached 0.0045%. Positive perpetual-futures funding generally means traders holding long positions pay those holding shorts, suggesting some demand to maintain bullish exposure despite the wider weakness.
The mixed readings leave the market without a clear bullish catalyst. CryptoQuant’s on-chain analytics also pointed to sell-side dominance in both assets’ derivatives markets. For XRP, large whale orders and elevated market activity added to concerns about selling pressure. These indicators describe current market conditions rather than confirming the direction of the next move.
XRP ETF Flows and Technical Levels
Institutional demand remains another factor for XRP traders. The supplied report cites a $3.61 million outflow from US spot XRP exchange-traded funds on Monday. However, reporting published on October 26 showed that these funds had recorded approximately $4.26 million in net weekly inflows for the week ending October 23, following $1.84 million in outflows the previous week. The figures cover different periods, so the latest weekly total should not be confused with a single-day flow.
Technically, XRP trades near $1.30, below its 100-day EMA at $1.333, 50-day EMA at $1.360 and 200-day EMA at $1.369. The RSI near 40 and negative MACD indicate weak momentum, although improving MACD readings may signal that selling pressure is easing.
Key levels include:
- XRP support: $1.300; a breakdown could extend losses.
- XRP resistance: $1.333, $1.360 and $1.369.
- XLM support: $0.153, with a sustained break risking further declines.
- XLM resistance: $0.173, followed by the $0.188–$0.190 EMA cluster.
XLM Outlook: Sellers Retain Control
XLM trades near $0.168, below its 50-day, 100-day and 200-day EMAs, clustered around $0.188–$0.190. Its daily RSI near 34 is approaching oversold territory, while the MACD remains negative. Oversold readings can precede a rebound, but they do not establish that a bottom is in place.
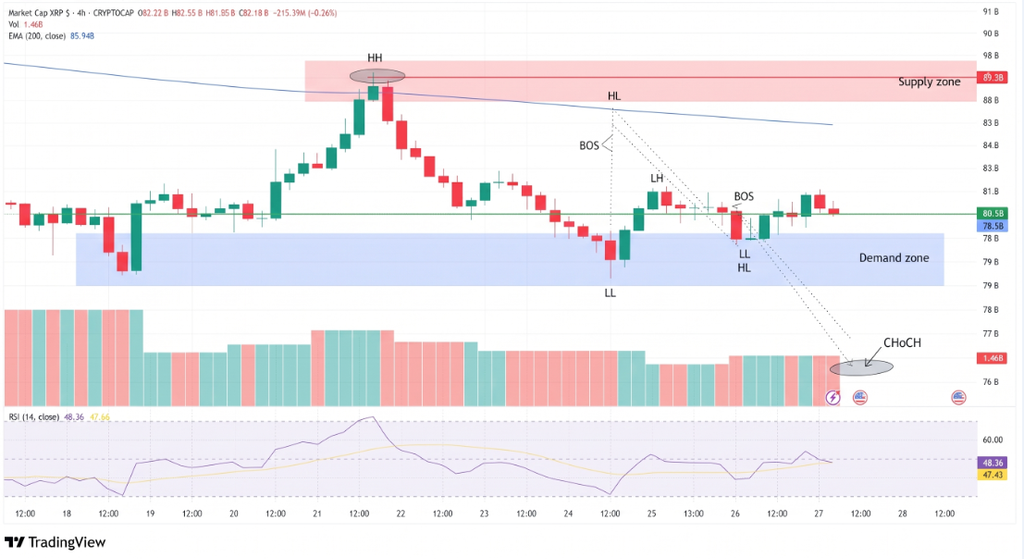
A move above $0.173 would provide an initial recovery signal. Stronger resistance lies at $0.188–$0.190, followed by $0.201 and $0.234. On the downside, $0.153 is the key support level identified in the supplied analysis.
Conclusion
XRP and XLM remain vulnerable while they trade below major moving averages. Positive funding rates offer a limited counter-signal, but sustained recoveries would require stronger buying and improving momentum. A break below $1.30 for XRP or $0.153 for XLM would increase downside risks; reclaiming nearby resistance would suggest selling pressure is easing.
Sources & Methodology
Primary-source standard: Market-moving facts should link to original data releases, regulator notices, company filings or official project announcements whenever available. Secondary reporting is used for additional context, not as a substitute for original evidence.
Page last reviewed: