
Cardano (ADA) traded near $0.221 on Thursday after failing to sustain a move above its 50-day exponential moving average (EMA) near $0.228 in the previous session. Weak derivatives positioning and fading bullish momentum are limiting the cryptocurrency’s recovery, leaving traders focused on support around $0.220. A sustained break below this level could expose ADA to further losses, while a recovery above nearby resistance would be needed to improve the technical outlook. The latest market data points to a cautious environment as investors assess whether buyers can regain control.
Cardano Derivatives Signal Bearish Sentiment
Data from CoinGlass showed Cardano’s long-to-short ratio at 0.79 on Thursday, approaching its lowest level in more than a month, according to the reported figures. A ratio below one indicates that short positions or accounts outweigh longs within the metric being measured, suggesting weaker bullish conviction. However, these ratios vary by exchange and methodology and do not represent the entire market.
ADA’s funding rate also turned negative on Wednesday, reaching -0.0025% on Thursday. In perpetual futures markets, negative funding generally means short-position holders pay long-position holders. This can indicate bearish positioning, although funding rates alone cannot predict the next price move.
On-chain and derivatives analysis attributed to CryptoQuant also points to selling pressure in spot and futures markets, alongside significant activity from large traders. Such conditions suggest that participants remain cautious about buying ADA at current levels.
The main indicators to watch are:
- Long-to-short ratio: 0.79, signalling relatively weak long positioning in the cited data.
- Funding rate: -0.0025%, indicating that short positions are paying longs.
- Market flows: Reported selling dominance across spot and futures trading.
ADA Price Tests Critical Support Levels
Cardano traded around $0.221, below its 50-day and 200-day EMAs, keeping the short-term outlook under pressure. The 100-day EMA near $0.220 represents the immediate support area. A sustained move below it could confirm that the recent recovery is losing strength.
Technical indicators reinforce the cautious outlook. The relative strength index (RSI) remained in the low-40s, reflecting subdued momentum without entering deeply oversold territory. Meanwhile, the moving average convergence divergence (MACD) stayed negative, suggesting that bearish momentum has not yet reversed.
ADA has also fallen below a rising support trend line near $0.210. That breakdown leaves the former trend-line area vulnerable to a retest if selling accelerates.
Cardano Price Forecast: What Comes Next?
The $0.220 level is the first key test for buyers. If ADA holds above this support, the token could attempt to recover toward the 50-day EMA near $0.230. Further resistance lies around $0.236, followed by the 200-day EMA near $0.240. A move toward $0.250 would require stronger buying pressure.
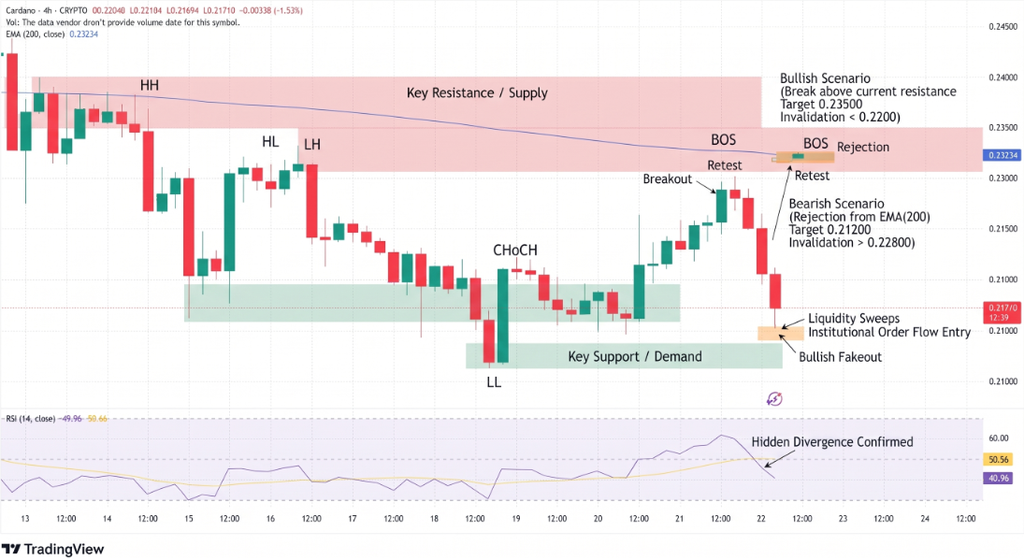
Conversely, a decisive break below $0.220 could bring $0.210 into focus. If that support also fails, the next broader downside reference is around $0.170, although such a move is not guaranteed.
Conclusion
Cardano’s recovery remains fragile as negative funding, a 0.79 long-to-short ratio and weak momentum indicators weigh on sentiment. Holding $0.220 could give buyers an opportunity to challenge resistance between $0.230 and $0.240. A sustained breakdown below $0.210 would increase downside risks toward $0.170. Traders should monitor price action and exchange-specific derivatives data for confirmation before treating either scenario as established.
Sources & Methodology
Primary-source standard: Market-moving facts should link to original data releases, regulator notices, company filings or official project announcements whenever available. Secondary reporting is used for additional context, not as a substitute for original evidence.
Page last reviewed: