
The USD/JPY pair is under renewed selling pressure as a weaker US dollar and expectations of further Bank of Japan (BoJ) tightening support the Japanese yen. The supplied market snapshot places the pair near 157.70, close to the lower boundary of its recent trading range. Technical indicators also point to weakening momentum, putting 157.50 in focus. However, the next move will depend on central bank guidance, Treasury yields and broader risk sentiment. A break below support could extend losses, while a recovery above nearby resistance may ease the immediate bearish pressure.
Dollar Weakness Supports the Yen
The US dollar has weakened as Treasury yields retreat from recent highs, reducing support for the greenback against major currencies. The yen has gained additional support from BoJ Governor Kazuo Ueda, who has indicated that policymakers must keep underlying inflation near the central bank’s 2% target and remain prepared to adjust interest rates further.
Markets are looking toward the BoJ’s October 29–30 meeting for updated economic forecasts and clues about the timing of its next rate increase. A December move remains a key possibility, although the timing is not guaranteed. Reuters reported on October 19 that Ueda sees underlying inflation approaching the target.
US monetary policy remains another important driver. Despite persistent inflation concerns, expectations for an immediate Federal Reserve rate increase have eased. Market pricing on October 21 put the probability of an October hike at 13.8%, compared with 76.3% for a December increase. These figures show that traders still anticipate possible tightening later in the year, but the timing remains uncertain.
USD/JPY Technical Levels to Watch
The supplied four-hour chart analysis indicates a bearish near-term bias, with the pair trading below the 50% Fibonacci retracement at 158.47. A break below the 100-period simple moving average near 158.07 reinforces the risk of additional selling.
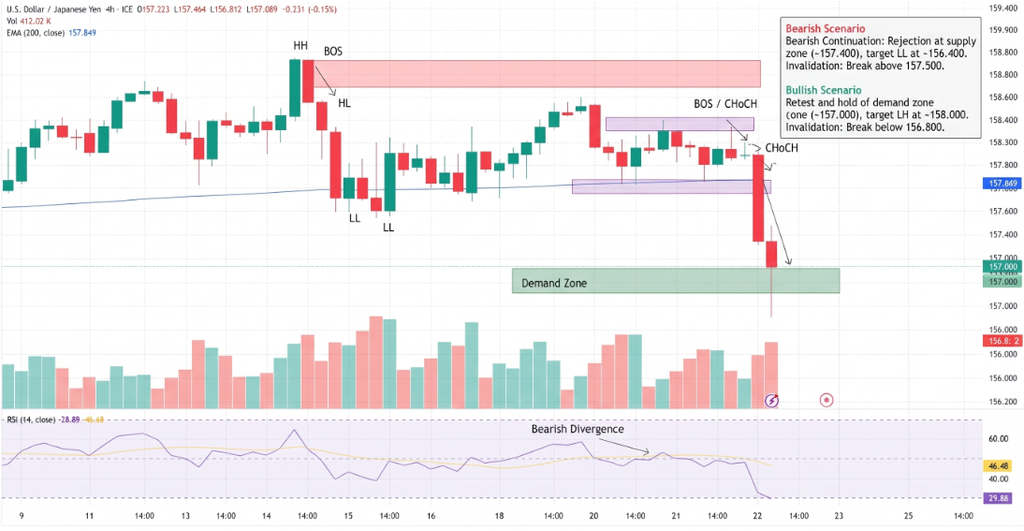
Momentum indicators also favor sellers. The Relative Strength Index (RSI) reading of 38.24 remains below the neutral 50 threshold, while the Moving Average Convergence Divergence (MACD) line is negative and below zero.
Key technical levels include:
- 157.50: Immediate trading-range support to monitor.
- 157.15: Next downside reference at the 38.2% Fibonacci level.
- 155.52: Deeper support near the 23.6% retracement.
- 152.88: Previous swing-low reference.
- 158.07–158.47: Initial resistance zone, including the 100-period SMA and 50% retracement.
A sustained break below 157.50 would strengthen the bearish case. Conversely, a recovery above 158.47 could weaken the immediate downside outlook and open the way toward 159.79.
Conclusion
The USD/JPY outlook remains tilted to the downside as dollar weakness and expectations of further BoJ tightening support the yen. A decisive break below 157.50 could expose 157.15 and then 155.52, while resistance between 158.07 and 158.47 remains the first hurdle for buyers. Upcoming central bank decisions could quickly change market expectations and trigger sharp moves. Traders should watch price confirmation at support and resistance rather than assume that the current bearish momentum guarantees further declines.
Sources & Methodology
Primary-source standard: Market-moving facts should link to original data releases, regulator notices, company filings or official project announcements whenever available. Secondary reporting is used for additional context, not as a substitute for original evidence.
Page last reviewed: