
Solana (SOL) traded near $101 on Monday, October 26, as persistent investment outflows and declining futures activity weighed on its recovery prospects. The cryptocurrency recorded its third consecutive weekly decline, including a 2% drop last week. Solana-focused exchange-traded funds (ETFs) registered $17.30 million in weekly outflows, while futures open interest fell to $6.18 billion. Although the network recently activated its Alpenglow upgrade, the immediate market outlook remains cautious, with the 200-day exponential moving average near $98 emerging as a critical support level.
Solana ETF Outflows Signal Weak Demand
Solana-focused investment funds recorded their third straight week of net outflows, with $17.30 million leaving the products last week. That brought the reported October outflow total to $72.24 million, suggesting institutional demand has weakened as SOL prices retreat. ETF outflows generally indicate that investors are withdrawing capital from funds, although they do not necessarily mean every underlying token has been sold immediately.
Derivatives activity also points to reduced market participation. Data from CoinGlass showed Solana futures open interest declining to $6.18 billion from $6.34 billion the previous week. Open interest measures the value of outstanding futures contracts. Falling open interest alongside a declining price can indicate that traders are closing positions, though it does not independently confirm whether selling pressure will continue.
Solana’s recent network development has yet to translate into a clear price recovery. The Alpenglow upgrade went live on mainnet on October 21, replacing the TowerBFT consensus system with Votor. The upgrade targets transaction finality of around 150 milliseconds, down from roughly 12.8 seconds under the previous system. Finality is the point at which a transaction is considered irreversible. The target is not a guarantee of identical performance under all network conditions.
SOL Technical Levels Define the Outlook
SOL traded around $101.45 in the supplied market snapshot, below its 50-day exponential moving average (EMA) near $105.99 but above its 200-day EMA at $98.27. This positioning suggests short-term weakness while the longer-term trend retains a potential support structure.
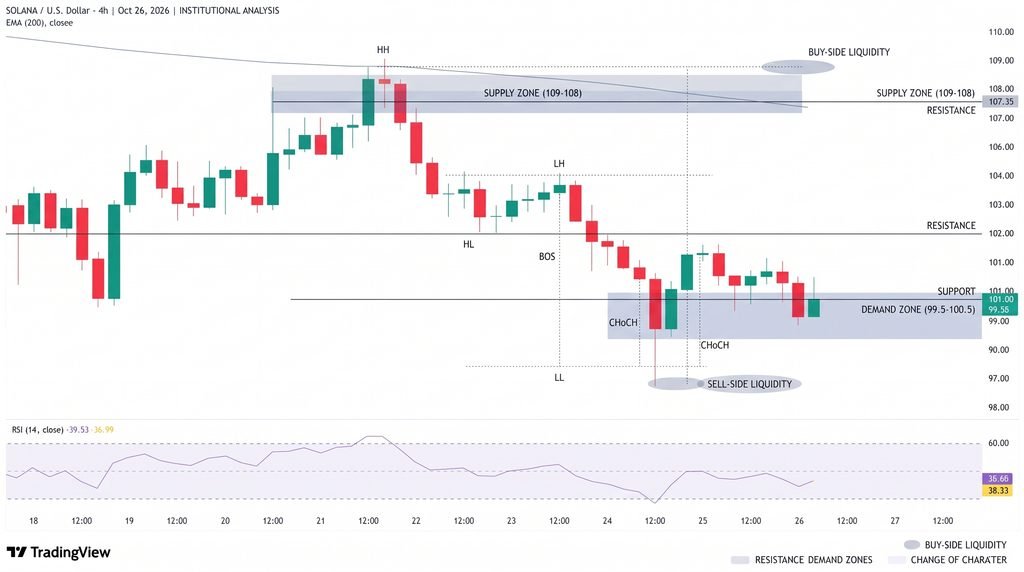
Momentum indicators remain soft. The daily Relative Strength Index (RSI) stood near 36, showing selling pressure without reaching the commonly used oversold threshold of 30. Meanwhile, the Moving Average Convergence Divergence (MACD) remained negative, with its line below the signal line.
Key levels to watch include:
- $98.27: 200-day EMA and immediate major support.
- $86.67: Rising trendline support if $98 breaks.
- $105.99: 50-day EMA and initial resistance.
- $122.94: September 25 high and a higher recovery target.
Conclusion
Solana’s near-term direction depends on whether buyers can defend the $98 area and recover above $106. A decisive break below the 200-day EMA could expose the rising trendline near $86.67, while a sustained move above $106 would improve the short-term outlook and put $122.94 back in focus. ETF flows, futures positioning and the market’s response to Alpenglow will remain important signals. For now, weaker investment demand and negative momentum leave SOL vulnerable to further volatility.
Sources & Methodology
Primary-source standard: Market-moving facts should link to original data releases, regulator notices, company filings or official project announcements whenever available. Secondary reporting is used for additional context, not as a substitute for original evidence.
Page last reviewed: