Silver remained under heavy selling pressure on Monday, trading around $53.91 after breaking below its major moving averages. The metal’s Relative Strength Index (RSI) dropped to 26.92, while the Money Flow Index (MFI) fell to 9.07, placing both indicators in deeply oversold territory. A doji candle near the recent lows suggests traders are becoming less decisive, but it does not yet confirm a reversal. Silver’s immediate outlook remains bearish unless buyers defend the $53.07 support level and push prices back above nearby resistance.
Silver Sell-Off Leaves Market Oversold
Silver’s price action reflects a strong downward trend. The supplied technical analysis shows the metal trading below its 20-, 50- and 200-period simple moving averages, a configuration that generally indicates persistent selling pressure. The descending channel remains active, while the SuperTrend indicator places resistance near $56.04.
The RSI, which measures the speed and magnitude of recent price changes, is below the widely watched 30 threshold. The MFI, which combines price and volume to estimate buying and selling pressure, is even lower at 9.07. These readings suggest the decline may be stretched, increasing the possibility of a short-term rebound. However, oversold conditions can persist during powerful downtrends.
The MACD remains bearish, with its reading at -1.07 below the signal line at -0.95. Silver is also trading near the lower Bollinger Band, around $52.32, indicating that prices are approaching the lower end of their recent volatility range.
The doji candle recorded on October 26 reflects indecision between buyers and sellers. Traders typically look for a subsequent bullish candle or a break above resistance before treating this pattern as evidence of a potential reversal.
Key Silver Support and Resistance Levels
The recent swing low at $53.07 is the first level buyers need to defend. If it holds, silver could attempt to recover toward the $55.75–$56.05 resistance zone, where the 20-period moving average and SuperTrend indicator converge.
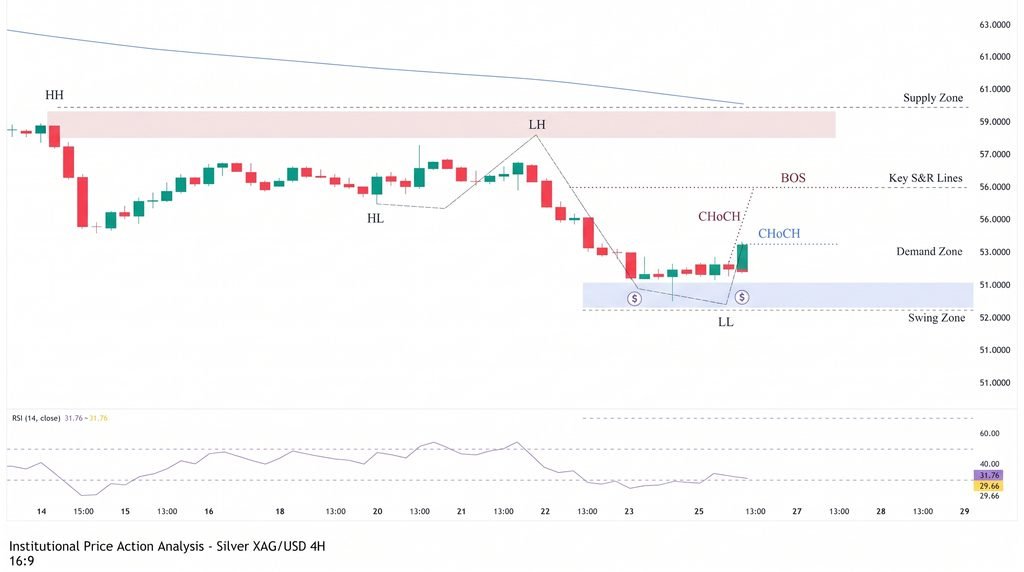
A decisive break below $53.07 would weaken the case for a near-term recovery. The supplied Fibonacci extension analysis identifies $48.16 as a possible downside reference if selling accelerates.
Key levels to monitor include:
- $53.07: Immediate support and recent swing low.
- $52.32: Lower Bollinger Band reference.
- $55.75–$56.05: Resistance zone and potential recovery test.
- $59.98: 38.2% Fibonacci retracement reference.
- $48.16: Potential downside extension if support breaks.
The average true range (ATR) is 0.74, or about 1.37% of the reference price, indicating that daily price movements remain significant.
Conclusion
Silver’s technical outlook remains bearish, despite signs that selling may be becoming stretched. A sustained hold above $53.07 followed by a break above $56.05 would strengthen the case for a recovery. If support fails, the $52.32 area and the $48.16 extension become important downside references. The doji and oversold indicators warrant attention, but neither guarantees that the decline has ended. Traders should wait for price confirmation rather than assume the market has reached a bottom.
Sources & Methodology
Primary-source standard: Market-moving facts should link to original data releases, regulator notices, company filings or official project announcements whenever available. Secondary reporting is used for additional context, not as a substitute for original evidence.
Page last reviewed: