Zcash extended its recovery above $1,300 on Wednesday, as persistent exchange-traded fund inflows and rising derivatives activity supported renewed buying interest. Grayscale’s Zcash-focused ETF attracted $3.45 million on Tuesday, extending its inflow streak to six consecutive days, while futures open interest climbed 16% over 24 hours. However, ZEC now faces a key technical barrier at $1,373. A sustained breakout could bring the previous swing high near $1,698 into view, while rejection at resistance could trigger another pullback.
ETF Inflows Strengthen Zcash Demand
Institutional demand has become an important factor in Zcash’s recovery. According to SoSoValue, Grayscale’s Zcash ETF, ticker ZCSH, recorded $3.45 million in net inflows on Tuesday, compared with $1.96 million a day earlier. The latest addition brought the week’s reported inflows to $5.41 million, following $41.09 million in net inflows during the previous week.
Six consecutive days of positive flows suggest sustained interest in gaining investment exposure to Zcash through a regulated fund. However, ETF inflows do not guarantee that the underlying token will continue rising, and fund flows can reverse as market conditions change.
Derivatives data also point to increased trading activity. CoinGlass reported that ZEC futures open interest rose 16% over 24 hours to approximately $2.91 billion in the supplied market snapshot. Open interest measures the value of outstanding derivatives contracts; an increase can reflect new positions entering the market but does not, by itself, reveal whether traders are predominantly bullish or bearish.
Liquidations provide another indication of the recent market imbalance. Of $8.11 million in liquidated positions, $7.58 million came from short sellers betting on lower prices. A positive funding rate of 0.0037% also indicated a modest premium paid by long-position holders in the referenced derivatives market. Together, these figures support a bullish short-term interpretation, although crowded long positions can increase the risk of a sharp reversal.
ZEC Targets $1,373 Resistance
Zcash’s technical structure remains constructive, with the price above its 50-day and 200-day exponential moving averages at $1,203 and $820, respectively. The wider gap between price and these averages indicates that the broader recovery remains intact.
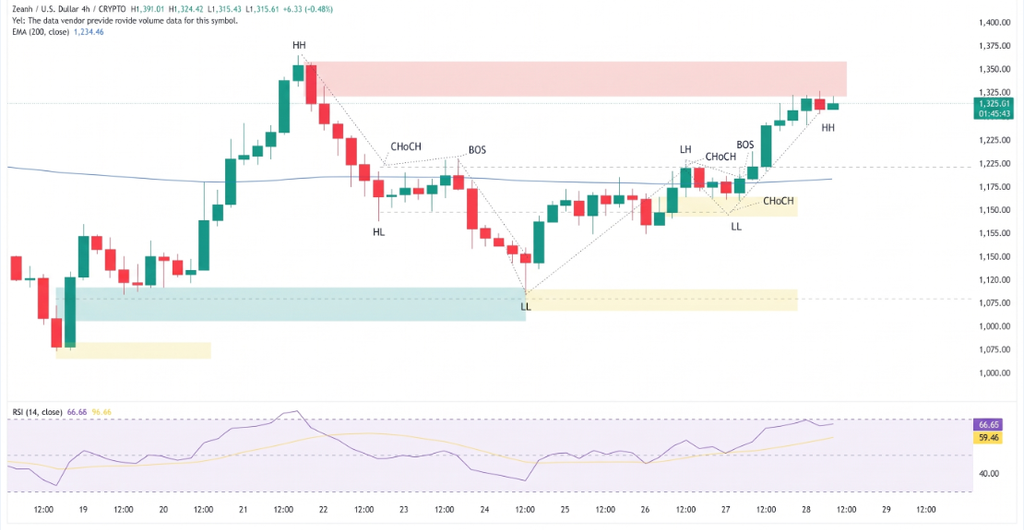
The immediate challenge is the 50% Fibonacci retracement at $1,373, calculated from the decline between $1,698 and $1,049. A confirmed daily close above this barrier could open a path toward $1,500 and the previous high at $1,698.
Momentum indicators are supportive but not decisive. The daily Relative Strength Index is near 55, indicating positive momentum without reaching the conventional overbought threshold of 70. The MACD also shows a strengthening positive profile.
Key levels to watch:
- Resistance: $1,373, then $1,500 and $1,698.
- Support: $1,203, followed by $1,049.
- Long-term support: The 200-day EMA near $820.
Conclusion: Breakout Confirmation Is Crucial
Zcash’s recovery is supported by consecutive ETF inflows, increased derivatives activity and improving technical momentum. Nevertheless, the $1,373 resistance level remains the decisive test. A sustained breakout could extend gains toward $1,698, while failure to clear resistance may expose support near $1,203.
Traders should monitor ETF flows, open interest and funding rates alongside price action. The current evidence favors buyers, but confirmation above resistance is necessary before treating the recovery as a sustained bullish breakout.
Sources & Methodology
Primary-source standard: Market-moving facts should link to original data releases, regulator notices, company filings or official project announcements whenever available. Secondary reporting is used for additional context, not as a substitute for original evidence.
Page last reviewed: