
Pi Network (PI) is showing early signs of recovery as its price approaches a major resistance level at $0.0794 on Friday. The improvement follows four ecosystem updates targeting developer tools, token tracking, application deployment and identity verification. PI was trading near $0.0783 at the time of the reported analysis, leaving the cryptocurrency just below a declining resistance trendline. Although technical indicators suggest selling pressure may be easing, a confirmed bullish reversal will require a sustained breakout and stronger buying activity.
Pi Network Introduces Four Ecosystem Updates
Pi Network announced several improvements to its developer platform on October 29, aiming to simplify application development and expand the network’s practical uses.
The first change involves a redesigned Developer Portal, where developers can manage application settings, domains, API keys, app wallets and privacy information through a consolidated configuration section. The redesigned interface is intended to make application setup and management more straightforward.
The second update introduces historical price tracking for Launchpad Testnet tokens through Pi BlockExplorer. Users can monitor how ecosystem tokens, including SLICE, change in value relative to Test-Pi. Pi Network clarified that these Testnet tokens will not migrate to Mainnet.
The third improvement adds AI-assisted application packaging to SoloHost. Developers can use compatible AI coding assistants to generate and validate configuration files required to publish existing applications through Pi Desktop.
The fourth development expands PiVerify, adding face-uniqueness checks and additional liveness verification options for third-party businesses. These features are designed to help identify duplicate identities and reduce fraudulent account activity.
Together, the updates focus on improving developer accessibility, application distribution and identity verification. Pi Network also says its SoloHost infrastructure can connect developers with a network of more than 420,000 Nodes.
PI Price Forecast: $0.0794 Resistance
PI traded around $0.0783 on Friday, approaching a declining resistance trendline connecting the June 20 and August 22 highs. The trendline sits near $0.0794, making it the first important level bulls need to overcome.
The 50-day Exponential Moving Average (EMA), near $0.0833, provides another resistance barrier. An EMA gives greater weight to recent prices and helps traders identify the direction of market momentum.
The daily Relative Strength Index (RSI) stands near 43, indicating relatively weak momentum without showing deeply oversold conditions. Meanwhile, the Moving Average Convergence Divergence (MACD) line has moved slightly above its signal line while remaining below zero. This suggests early stabilization rather than an established upward trend.
Important price levels include:
- $0.0794: Immediate trendline resistance.
- $0.0833: 50-day EMA resistance.
- $0.1049: 50% Fibonacci retracement level.
- $0.1124: 200-day EMA resistance.
- $0.1394: Previous cycle high.
A sustained move above $0.0794, followed by a break through $0.0833, would strengthen the bullish recovery argument.
$0.0704 Support Remains Critical
On the downside, $0.0704 represents the major structural support identified by the Fibonacci analysis. This level corresponds to the lower price anchor of the decline from $0.1392.
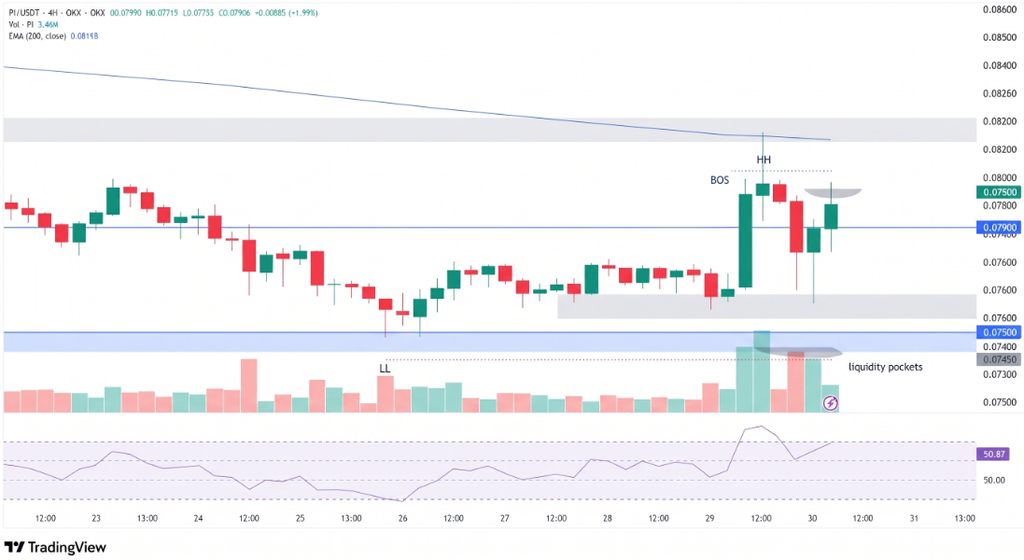
If sellers regain control and PI fails to maintain its recovery, a move toward $0.0704 could become possible. A decisive break below that level would weaken the current reversal outlook and expose the token to additional downside risk.
However, improving ecosystem functionality could help strengthen long-term interest if developers successfully introduce useful applications and attract more users.
Conclusion
Pi Network’s four technical updates demonstrate continued efforts to expand its ecosystem beyond token transfers. Nevertheless, improved infrastructure does not automatically translate into higher PI prices. The $0.0794 trendline and $0.0833 moving average remain the immediate tests for buyers, while $0.0704 is the key downside level. A confirmed breakout, supported by stronger trading volume and sustained momentum, would provide more convincing evidence of a bullish reversal.
Sources & Methodology
Primary-source standard: Market-moving facts should link to original data releases, regulator notices, company filings or official project announcements whenever available. Secondary reporting is used for additional context, not as a substitute for original evidence.
Page last reviewed: