
Brent crude’s technical outlook is at a crossroads, with a supplied trading dashboard showing prices near $111.97 inside the Ichimoku cloud. The broader trend remains positive, supported by the 50-day and 200-day moving averages, but weaker volume, bearish momentum divergence and resistance near $115 raise the risk of a deeper correction. Traders are watching three important areas: $108.90 support, $115 resistance and the recent high at $117.45.
Brent Oil Signals a Market Standoff
The dashboard places Brent above its 50-day simple moving average (SMA) of $110.76 and its 200-day SMA of $104.48. This positioning suggests that the longer-term upward trend remains intact. The Moving Average Convergence Divergence (MACD) indicator also shows a bullish crossover, with its line at 0.18 above the signal line at 0.10.
Short-term indicators are less encouraging. The SuperTrend indicator signals a bearish regime, with resistance near $114.88. The volume-weighted average price (VWAP), at $112.35, is also above the quoted market level, suggesting sellers have controlled recent intraday trading.
Brent is positioned inside the Ichimoku cloud, which extends from $111.18 to $112.38. Trading within this band often reflects uncertainty rather than a clear trend. A doji candle recorded near $111.97 on October 30 reinforces that indecision.
The Average True Range (ATR) is $1.73, equivalent to approximately 1.54% of the quoted price. Meanwhile, bearish RSI divergence near the $117.45 peak and declining volume suggest that buying momentum has weakened.
$108.90 Support Meets $115 Resistance
The dashboard identifies $108.90-$109.50 as the main potential buying zone. It combines the 38.2% Fibonacci retracement at $108.93 with lower Bollinger Band support. A sustained move below this area would weaken the bullish structure.
On the upside, resistance between $114.00 and $114.88 could limit recovery attempts. The dashboard also identifies a potential bull flag near $112, although its reported 70% completion does not confirm a breakout.
Key levels include:
- Support: $108.90-$109.50, followed by $106.29.
- Resistance: $114.00-$114.88, then $115.
- Upside targets: $117.45, $120 and $123.52.
- Further downside: $104.48 and $103.66.
Brent Oil Forecast: Bull or Bear?
A bullish scenario requires Brent to clear $115 with expanding trading volume. A successful breakout could put the recent $117.45 high in focus, followed by psychological resistance at $120. The 127.2% Fibonacci extension at $123.52 represents a more distant target.
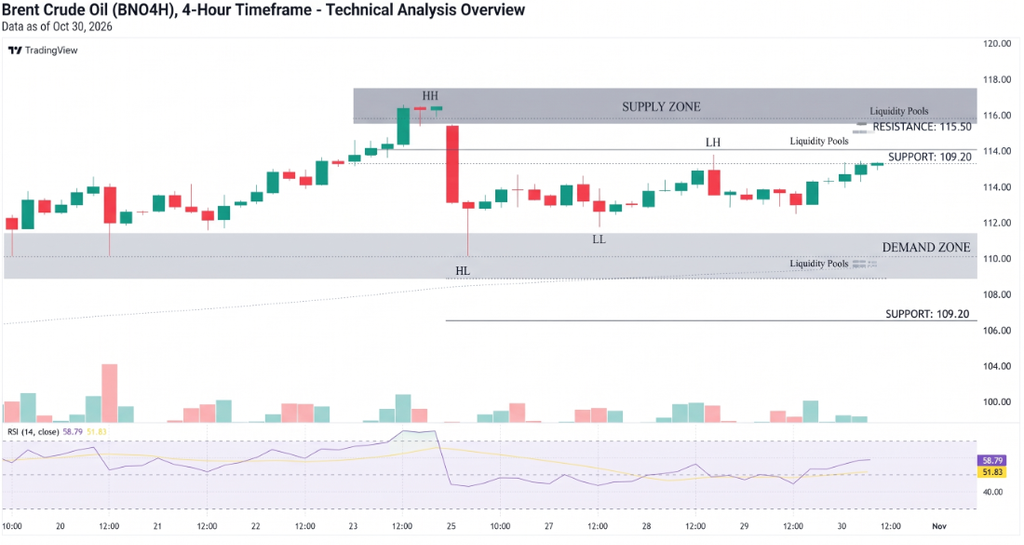
The bearish scenario begins with a rejection near $112.35-$114.88 or a decisive break below $108.90. That could expose $106.29, the 200-day SMA at $104.48 and the 61.8% retracement at $103.66.
For now, the dashboard classifies $110.50-$113.00 as a no-trade area. Its ADX reading of 13.16 indicates weak trend strength, making false breakouts more likely.
Conclusion
Brent’s broader trend remains positive, but the immediate setup is neutral. A confirmed move above $115 or below $108.90 would provide a clearer directional signal. Until then, consolidation and sharp reversals remain possible.
Sources & Methodology
Primary-source standard: Market-moving facts should link to original data releases, regulator notices, company filings or official project announcements whenever available. Secondary reporting is used for additional context, not as a substitute for original evidence.
Page last reviewed: